

Revenue dashboard snapshot ppt examples professional





Try Before you Buy Download Free Sample Product
 Impress Your
Audience
 100%
Editable
 Save Hours
of Time


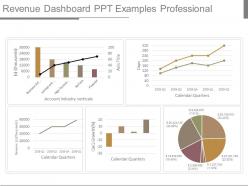
Highlight critical inputs with our Revenue Dashboard Snapshot Ppt Examples Professional. Focus on important bits of information.
People who downloaded this PowerPoint presentation also viewed the following :
Revenue dashboard snapshot ppt examples professional with all 4 slides:
No matter what line of business you are involved in we have a Revenue Dashboard Snapshot Ppt Examples Professional ready for you to download. Their design and quality are sure to leave your audience impressed.


FAQs for Revenue dashboard snapshot
Key revenue dashboard metrics include total revenue, revenue growth rate, monthly/quarterly recurring revenue, customer acquisition cost, average deal size, conversion rates, and sales pipeline value. These metrics enable organizations to track performance trends, identify growth opportunities, and optimize sales strategies across departments, with many companies finding that comprehensive revenue visibility ultimately drives better forecasting accuracy and strategic decision-making.
Data visualization enhances revenue dashboard effectiveness by transforming complex financial metrics into clear charts, graphs, and visual summaries that stakeholders can quickly interpret and act upon. Through strategic use of color coding, trend lines, and interactive elements, organizations streamline decision-making processes, identify revenue opportunities faster, and communicate financial performance more persuasively, ultimately delivering greater stakeholder engagement and more informed strategic planning.
Common revenue models for dashboard showcases include subscription recurring revenue, transactional sales, freemium conversions, advertising revenue, and commission-based earnings. These models enable organizations to track performance across different streams, optimize pricing strategies, and demonstrate growth trajectories, with many businesses finding that visual revenue comparisons enhance stakeholder understanding and drive strategic decision-making.
Different industries select critical revenue KPIs based on their unique business models, customer lifecycles, regulatory requirements, and competitive landscapes, with considerations including transaction frequency, customer acquisition costs, and seasonal patterns. For example, SaaS companies prioritize monthly recurring revenue and churn rates, while retail focuses on same-store sales growth and inventory turnover, ultimately enabling each sector to optimize performance tracking.
Comparative data enables organizations to identify revenue patterns, seasonal fluctuations, growth trajectories, and performance gaps by benchmarking against previous periods, competitors, or industry standards. Through strategic analysis of year-over-year, quarter-over-quarter, and market comparisons, businesses streamline forecasting accuracy, enhance resource allocation decisions, and ultimately deliver competitive advantages, with many financial teams finding that comparative insights accelerate strategic planning processes.
Revenue projections alongside historical data can be effectively represented through trend line charts, waterfall diagrams, comparative bar graphs, and side-by-side timeline visualizations that highlight growth patterns. These presentation approaches streamline complex financial storytelling by showcasing actual performance context, projected trajectory analysis, and variance identification, with many financial teams finding that integrated visual formats enhance stakeholder comprehension and strategic decision-making confidence.
Effective revenue dashboard design incorporates clean layouts with strategic white space, consistent color coding for different revenue streams, intuitive data visualization through charts and graphs, clear typography hierarchy, and logical information grouping. These elements work together by reducing cognitive load, enabling quick pattern recognition, and facilitating faster decision-making, with many finance teams finding that well-designed dashboards significantly enhance stakeholder engagement and strategic discussions.
Revenue breakdown should present product lines through clear hierarchical visualization, comparative metrics, trend analysis, and performance indicators that highlight top performers and growth opportunities. Strategic presentation includes percentage contributions, year-over-year comparisons, and visual emphasis on highest-margin services, with many organizations finding that color-coded segmentation and drill-down capabilities enable executives to quickly identify strategic priorities and resource allocation decisions.
Best practices for interactive revenue dashboard elements include incorporating clickable drill-down charts, dynamic filters for time periods and segments, hover tooltips with detailed metrics, and responsive buttons for switching between views. These interactive features enhance audience engagement by enabling real-time data exploration, facilitating deeper analysis during presentations, and ultimately delivering more compelling stakeholder discussions with improved decision-making outcomes.
Revenue dashboard accuracy requires establishing automated data connections, implementing regular validation checks, setting up real-time sync protocols, and creating audit trails for all data sources. Through integrated APIs and scheduled refresh cycles, organizations streamline data flow from CRM systems, financial platforms, and sales tools, while automated alerts flag discrepancies, ultimately delivering reliable insights that drive strategic decision-making.
Revenue data storytelling techniques include using comparative narratives, trend-based progression stories, cause-and-effect frameworks, customer journey mapping, and seasonal performance arcs. These approaches transform raw numbers into compelling business narratives by connecting financial outcomes to strategic decisions, market conditions, and operational changes, with many organizations finding that contextualizing revenue through relatable scenarios significantly enhances stakeholder engagement and decision-making effectiveness.
Tailoring revenue dashboards involves customizing metrics, visualizations, and detail levels based on each stakeholder's priorities and decision-making needs. Executives typically require high-level KPIs like total revenue growth and margin trends, while sales teams need granular data including pipeline conversion rates, individual performance metrics, and territory-specific insights, ultimately enabling more targeted strategies and faster, data-driven decisions across organizational levels.
Challenges include currency fluctuations, varying fiscal years across regions, different taxation structures, regional compliance requirements, and time zone considerations for real-time data. These complexities require strategic data normalization, standardized reporting periods, and flexible visualization frameworks, with many multinational organizations finding that layered dashboard approaches ultimately deliver clearer insights while maintaining comprehensive global oversight.
Integrate qualitative data through text boxes highlighting key customer feedback themes, color-coded status indicators for market sentiment, and visual annotations explaining revenue fluctuations. Strategic combinations like embedding NPS scores alongside revenue metrics, customer testimonial snippets near performance indicators, and market condition summaries enable comprehensive storytelling, with many organizations finding that this approach delivers deeper insights and more informed decision-making for stakeholders.
**INPUT**: What tools and software are most effective for creating professional revenue dashboard presentations? **OUTPUT**: Effective revenue dashboard tools include PowerPoint, Tableau, Power BI, Google Data Studio, and specialized platforms like Klipfolio and Geckoboard. These platforms streamline financial reporting by integrating real-time data sources, automating calculations, and delivering customizable visualizations, with many organizations finding that strategic combinations enhance stakeholder engagement while significantly reducing manual reporting time. [Word count: 53 words]
-
Really like the color and design of the presentation.
-
Easily Editable.