

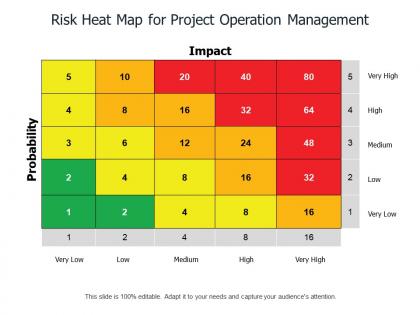
Risk heat map for project operation management




Try Before you Buy Download Free Sample Product
 Impress Your
Audience
 100%
Editable
 Save Hours
of Time


Establish how animosity has been generated with our Risk Heat Map For Project Operation Management. Investigate the cause of intolerance.
People who downloaded this PowerPoint presentation also viewed the following :
Risk heat map for project operation management with all 5 slides:
Get folks to invest in eco-friendly endeavors with our Risk Heat Map For Project Operation Management. Earn the gratitude of generations to come.


FAQs for Risk heat map for
A risk heat map is a visual matrix that plots risks by probability and impact severity, using color coding to prioritize threats requiring immediate attention. Financial services, healthcare institutions, and manufacturing companies utilize these strategic tools to streamline resource allocation, enhance decision-making processes, and communicate risk exposure across organizational levels, ultimately delivering improved operational efficiency and proactive risk mitigation strategies.
Organizations determine appropriate risk criteria by evaluating probability levels, impact severity, business objectives, regulatory requirements, and industry-specific factors through stakeholder consultation and historical data analysis. Financial services companies, manufacturing firms, and healthcare organizations typically customize criteria based on their operational priorities, risk appetite, and compliance standards, ultimately delivering more accurate risk assessments and strategic decision-making capabilities.
Risk heat maps include probability assessments, impact severity ratings, risk categories, likelihood scales, and consequence measurements. These components work together by providing visual risk prioritization, enabling strategic resource allocation, and facilitating informed decision-making across departments, with many organizations finding that comprehensive heat maps ultimately deliver enhanced operational efficiency and proactive risk management capabilities.
A risk heat map enhances decision-making by providing visual clarity on threat severity and likelihood, enabling leaders to prioritize resources strategically and respond to critical vulnerabilities first. Through color-coded matrices, executives can quickly identify high-impact risks across departments like finance, operations, and compliance, ultimately streamlining resource allocation and improving organizational resilience in an increasingly complex business environment.
Common software tools for creating risk heat maps include Microsoft Excel, Tableau, Power BI, R, Python, GRC platforms like MetricStream, and specialized risk management software such as LogicGate and ServiceNow. These tools streamline risk visualization by automating data collection, enabling real-time updates, and providing interactive dashboards, with many organizations finding that integrated platforms deliver enhanced compliance tracking and strategic decision-making capabilities.
Color coding in risk heat maps significantly influences stakeholder perception by creating immediate visual hierarchy, with red zones triggering urgency responses while green areas suggest lower priority attention. This psychological impact can drive resource allocation decisions, with many organizations finding that strategic color choices enhance stakeholder engagement, streamline risk communication, and ultimately accelerate decision-making processes across different organizational levels.
Best practices for updating risk heat maps include establishing regular review cycles, incorporating real-time data feeds, engaging cross-functional stakeholders, conducting periodic risk assessments, and maintaining clear documentation protocols. These approaches streamline risk monitoring by ensuring accuracy, relevance, and organizational alignment, with many financial institutions and manufacturing companies finding that quarterly updates combined with continuous monitoring ultimately delivers enhanced decision-making and proactive risk management.
Risk heat maps integrate into enterprise risk management frameworks by serving as visual dashboards for board reporting, feeding into strategic planning processes, and connecting operational risks to business objectives. Through centralized risk platforms, organizations streamline risk assessment workflows, enhance cross-departmental communication, and automate compliance reporting, with many enterprises finding that integrated heat maps deliver faster risk responses and improved strategic decision-making capabilities.
Stakeholder collaboration ensures comprehensive risk identification, accurate impact assessment, and realistic probability evaluations by incorporating diverse perspectives from operations, finance, compliance, and management teams. This collaborative approach enhances the heat map's accuracy and organizational buy-in, while enabling better resource allocation and risk mitigation strategies, ultimately delivering more effective enterprise-wide risk management and strategic decision-making capabilities.
Organizations can effectively communicate risk heat map findings through visual storytelling, simplified color coding, executive summaries with clear priorities, and sector-specific examples that translate technical data into business language. By presenting risks as strategic scenarios with potential financial impacts, timeline implications, and actionable mitigation steps, leaders can engage stakeholders meaningfully, ultimately enabling informed decision-making and organizational alignment around risk management priorities.
Common pitfalls include oversimplifying complex risks, using inconsistent evaluation criteria, failing to update assessments regularly, and neglecting stakeholder input during development. Organizations should avoid static designs that don't reflect changing business environments, while ensuring clear definitions and standardized scales across departments, ultimately delivering actionable insights rather than superficial risk representations.
Risk heat maps can be adapted by customizing risk categories, probability scales, and impact measurements to reflect sector-specific threats and regulatory requirements. Financial institutions might emphasize credit and operational risks, while manufacturing companies focus on supply chain disruptions and safety hazards, with healthcare organizations prioritizing patient safety and compliance risks, ultimately enabling more targeted risk management strategies.
Risk heat maps typically quantify risks using probability of occurrence, potential impact severity, financial exposure amounts, detection likelihood, and risk velocity metrics. These measurements enable organizations to systematically evaluate threats across departments like operations, compliance, and cybersecurity, ultimately delivering prioritized risk mitigation strategies and enhanced resource allocation for maximum protective value.
Risk heat maps facilitate emerging risk identification by enabling pattern recognition across risk categories, tracking velocity changes in probability and impact scores, and highlighting previously low-priority risks gaining momentum. Through dynamic visualization and regular updates, organizations can spot interconnected risk clusters, monitor shifting risk landscapes, and detect early warning signals, ultimately enabling proactive risk mitigation strategies before threats escalate.
Historical data enhances risk heat map accuracy by identifying patterns, trends, and frequency of past incidents, enabling organizations to calibrate probability assessments and impact predictions more precisely. Through predictive analytics and trend analysis, companies in sectors like banking, insurance, and manufacturing can refine their risk models, ultimately delivering more reliable forecasting and strategic decision-making capabilities.
No Reviews