

Russia ukraine war map infographics document report doc pdf ppt





Try Before you Buy Download Free Sample Product
 Impress Your
Audience
 100%
Editable
 Save Hours
of Time


Russia Ukraine War
People who downloaded this PowerPoint presentation also viewed the following :
Russia ukraine war map infographics document report doc pdf ppt with all 22 slides:
Use our Russia Ukraine War Map Infographics Document Report Doc Pdf Ppt to effectively help you save your valuable time. They are readymade to fit into any presentation structure.









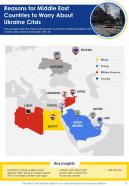
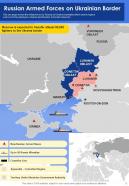


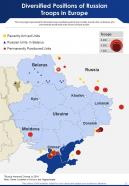

FAQs for Russia ukraine war map infographics document report
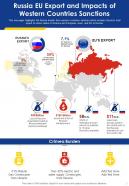
Recent infographics highlight several critical regions including eastern Ukraine's Donetsk and Luhansk oblasts, southern territories like Kherson and Zaporizhzhia, the strategic port city of Mariupol, and northern border areas near Kharkiv. These geographical visualizations enable organizations, media outlets, and educational institutions to deliver clearer situational awareness, enhanced strategic analysis, and more comprehensive reporting, ultimately providing stakeholders with better informed perspectives on this evolving conflict.
Infographics represent shifting frontlines through animated timelines, color-coded territorial maps, before-and-after comparisons, and interactive overlays that track regional control changes over time. These visual tools enable news organizations, analysts, and educational institutions to communicate complex geopolitical developments clearly, ultimately delivering enhanced public understanding and strategic awareness of evolving conflict dynamics.
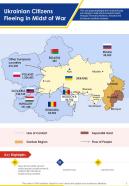
Data visualizations highlight the humanitarian crisis through refugee displacement maps, casualty statistics, infrastructure damage assessments, medical facility impacts, and food security indicators. These compelling visual representations enable international organizations, governments, and NGOs to communicate the war's devastating human toll more effectively, ultimately driving faster humanitarian responses, resource allocation, and global awareness campaigns that deliver critical aid to affected populations.
Infographics play a crucial role in translating complex military data into accessible visual formats, helping media organizations, analysts, and policymakers communicate troop movements, territorial changes, supply routes, and strategic positions effectively. These visual tools streamline information processing by combining geographic data, timelines, and tactical elements into comprehensive overviews, ultimately enabling faster decision-making and enhanced public understanding of evolving conflict dynamics.
Interactive maps enhance understanding of the Russia-Ukraine war's progression by enabling viewers to visualize territorial changes, troop movements, and strategic developments through dynamic timelines and layered data presentations. These digital tools allow users to toggle between different timeframes, examine specific regions in detail, and access contextual information about key battles, ultimately delivering comprehensive insights that static maps cannot provide, with many news organizations and analysts finding that interactive elements significantly improve audience engagement and comprehension.
War mapping for Ukraine relies on satellite imagery, open-source intelligence (OSINT), military reports, social media verification, and real-time news feeds from conflict zones. These sources enable cartographers and analysts to track territorial changes, troop movements, and infrastructure impacts with increasing accuracy, while many defense organizations and media outlets find that combining multiple data streams delivers more reliable situational awareness for strategic decision-making.
Demographic infographics illustrate population displacement through migration flow maps, refugee distribution charts, internally displaced person statistics, and comparative population density visualizations across affected regions. These visualizations enable policymakers, humanitarian organizations, and international agencies to track displacement patterns, allocate resources more effectively, and coordinate relief efforts, while helping the global community understand the conflict's profound human impact on millions of displaced families.
Military infographics commonly use standardized NATO symbols, color-coded arrows for troop movements, scaled icons for equipment quantities, territorial shading for control zones, and timeline overlays for operational phases. These visual elements streamline complex battlefield data by combining geographic mapping with symbolic representation, enabling audiences to quickly comprehend force distributions, strategic positions, and conflict progression across multiple theaters of operation.
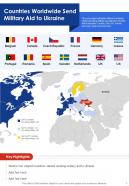
Infographics help clarify complex political relationships in the Russia-Ukraine conflict by visualizing alliance networks, economic dependencies, military support flows, and diplomatic positions through clear charts, maps, and diagrams. These visual tools enable organizations, media outlets, and educational institutions to transform intricate geopolitical data into accessible formats, ultimately delivering enhanced understanding and informed decision-making across international relations.
Visual narratives in conflict infographics shift public perception through strategic color choices, selective data highlighting, geographic framing, and symbolic imagery that emphasize particular aspects of the situation. These design elements influence emotional responses and understanding, with news organizations, governments, and advocacy groups finding that thoughtful visual storytelling can enhance comprehension while presenting balanced, factual information that respects the complexity of geopolitical situations.
Historical context and previous territorial disputes significantly inform current war mapping by highlighting regions like Crimea, Donetsk, and Luhansk, where longstanding ethnic tensions, economic interests, and strategic military positions converge. These historical patterns enable analysts, policymakers, and military strategists to better predict conflict zones, resource allocation needs, and potential escalation points, ultimately delivering more informed decision-making and strategic planning capabilities.
Ethical considerations include ensuring factual accuracy, respecting victims' dignity, avoiding sensationalism, protecting sensitive information, and maintaining balanced perspectives while acknowledging human suffering. These principles enable organizations, media outlets, and educational institutions to deliver responsible visual communications that inform audiences without exploiting tragedy, ultimately fostering informed public discourse while honoring those affected by conflict.
Social media platforms have revolutionized conflict infographic dissemination by enabling real-time sharing, viral amplification, and global reach across diverse audiences. These platforms facilitate instant updates, cross-platform distribution, and community-driven content verification, with news organizations, analysts, and educational institutions finding that visual data reaches millions within hours, ultimately delivering enhanced public awareness and strategic communication advantages.
Infographic presentations significantly enhance educational initiatives about the Russia-Ukraine conflict by transforming complex geopolitical data into accessible visual narratives, timeline progressions, and geographic analyses that students can readily comprehend. These visual tools enable educators to present military movements, humanitarian impacts, and regional consequences more effectively, with many educational institutions finding that infographics improve student engagement and retention of critical information.
Infographics enhance traditional maps by integrating real-time data, casualty figures, economic impacts, and timeline progressions into a single visual narrative, while traditional maps primarily show territorial boundaries and geographic features. Through interactive elements, color-coded severity indicators, and statistical overlays, infographics enable military analysts, journalists, and policymakers to comprehend complex battlefield dynamics more rapidly, ultimately delivering strategic insights that static maps cannot provide.
-
Qualitative and comprehensive slides.
-
Excellent work done on template design and graphics.