

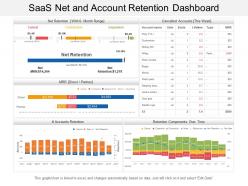
Saas net and account retention dashboard





Try Before you Buy Download Free Sample Product
 Impress Your
Audience
 100%
Editable
 Save Hours
of Time


Use our Saas net and account retention dashboard presentation design for your next business presentation. For Saas companies to be successful, the customers must be successful first. Acquiring new customers and retaining the existing ones is important part of any Saas company as they rely on monthly recurring revenue to grow and excel. Our PowerPoint template has been designed on the Saas net and account retention process after a complete research done by our team of designing experts. Customer retention is vital for the Saas businesses as acquiring new customers is quite difficult. Training new customers minimize churn and save time and money for the company. This PPT diagram comes with graph in excel format that makes it possible for you to present the concept in the most organized way. Not many people are aware of the process the Saas companies work but with this presentation graphic, you can easily communicate the message to them. Download the Saas net and account retention dashboard PPT slide to deliver the information. Establish the fact that you have the drive with our Saas Net And Account Retention Dashboard. Display a go getting attitude.
People who downloaded this PowerPoint presentation also viewed the following :
Saas net and account retention dashboard with all 6 slides:
Demonstrate coolness with our Saas Net And Account Retention Dashboard. You will be credited with aplomb.


FAQs for Saas net and
SaaS account retention dashboards should include churn rate, customer lifetime value, net revenue retention, monthly recurring revenue trends, and customer health scores. These metrics enable organizations to identify at-risk accounts, optimize renewal strategies, and enhance customer experiences, with many SaaS companies finding that comprehensive dashboards deliver improved retention rates and increased revenue growth.
Churn rate is calculated by dividing customers lost during a period by total customers at the period's start, then visualized through trend lines, cohort analyses, and segmentation charts on retention dashboards. These visualizations enable SaaS companies to identify at-risk customer segments, seasonal patterns, and retention bottlenecks, ultimately delivering targeted intervention strategies and improved customer lifetime value.
Customer segmentation enables retention dashboards to deliver targeted insights by categorizing users based on behavior patterns, usage frequency, contract values, industry sectors, and churn risk levels. This strategic approach helps SaaS companies personalize retention strategies for different customer tiers, with high-value enterprise clients receiving proactive account management while smaller segments get automated engagement campaigns, ultimately improving retention rates and optimizing resource allocation across diverse customer portfolios.
The dashboard identifies churn patterns by tracking usage frequency, feature adoption rates, support ticket volumes, billing issues, and engagement metrics across customer segments. Through predictive analytics and cohort analysis, SaaS companies can pinpoint early warning signals like declining logins or reduced feature utilization, ultimately enabling proactive retention strategies before customers actually churn.
**INPUT**: What are the best practices for timing the updates and reviews of a retention dashboard? **OUTPUT**: Best practices include daily data refreshes, weekly trend analysis, monthly comprehensive reviews, quarterly strategic assessments, and real-time alerts for critical metrics like churn spikes. These structured intervals enable organizations to maintain current insights while providing deeper strategic context, with many SaaS companies finding that combining automated daily updates with scheduled monthly stakeholder reviews delivers both operational responsiveness and strategic alignment. [Word count: 60 words]
A/B testing results integrate into SaaS account retention dashboards through automated data feeds, visual comparison widgets, cohort analysis panels, and real-time performance tracking modules. These integrations enable product teams to monitor feature adoption rates, user engagement patterns, and retention impact metrics directly within their dashboards, ultimately delivering data-driven insights that enhance decision-making and accelerate product optimization strategies.
Effective retention visualizations include cohort heatmaps, churn rate trend lines, customer lifetime value charts, retention funnel graphics, and segmented retention curves. These dashboards enhance stakeholder understanding by presenting complex retention patterns through intuitive visual formats, enabling executives to quickly identify at-risk segments, track improvement initiatives, and make data-driven decisions that ultimately drive strategic account management and revenue optimization.
User feedback should be incorporated through survey integrations, support ticket analysis, feature request tracking, and churn exit interviews to create comprehensive retention insights. This strategic combination enables SaaS companies to identify pain points, prioritize product improvements, and proactively address concerns, with many organizations finding that feedback-driven dashboards reduce churn by highlighting actionable retention opportunities before customers disengage.
AI-driven tools that augment SaaS account retention dashboards include predictive analytics engines, customer health scoring algorithms, churn prediction models, behavioral pattern recognition systems, and automated alert mechanisms. These technologies streamline retention efforts by identifying at-risk accounts early, personalizing engagement strategies, and automating intervention workflows, with many SaaS companies finding significantly improved retention rates and proactive customer success outcomes.
Customer engagement metrics can be captured through user activity tracking, feature adoption monitoring, support interaction logs, and behavioral analytics tools, then displayed via interactive charts, trend graphs, and real-time scorecard widgets. Through comprehensive dashboards, SaaS companies streamline retention strategies by visualizing login frequency, session duration, and feature utilization patterns, ultimately enabling proactive interventions and improved customer lifetime value.
Historical data enables retention strategies by identifying customer behavior patterns, churn predictors, usage trends, and successful intervention outcomes through advanced analytics and machine learning algorithms. Through predictive modeling, organizations can proactively target at-risk accounts, optimize engagement timing, and personalize retention campaigns, with many SaaS companies finding that data-driven approaches increase retention rates by 15-25%.
A retention dashboard can be tailored by customizing metrics and visualizations for each department's specific objectives, such as churn prediction models for sales, campaign effectiveness tracking for marketing, and ticket resolution correlations for customer support. Through role-based interfaces and department-specific KPIs, teams access relevant retention insights while maintaining unified data sources, ultimately enabling coordinated strategies and improved cross-departmental collaboration.
Common pitfalls include overwhelming users with excessive metrics, focusing on vanish metrics rather than actionable insights, poor data visualization that obscures trends, and lack of real-time updates. These issues can be avoided by prioritizing key retention indicators like churn rate and customer lifetime value, implementing intuitive design with clear visual hierarchies, and ensuring seamless integration with CRM systems, ultimately delivering actionable intelligence that enables proactive customer success strategies.
Social proof integration involves displaying customer success metrics, testimonial widgets, case study highlights, user adoption rates, and peer comparison data directly within retention dashboards. This strategy enhances customer confidence by showcasing real success stories from similar organizations, while providing account managers with powerful retention tools that demonstrate proven value, ultimately reducing churn through validated social evidence.
Customer usage patterns reveal declining engagement trends, feature adoption gaps, at-risk account indicators, renewal probability scores, and expansion opportunities. Through behavioral analytics, organizations can proactively address churn risks, optimize onboarding processes, and identify upselling potential, with many SaaS companies finding that pattern-driven interventions ultimately enhance retention rates and maximize customer lifetime value.
No Reviews