Sales decline in a carbonated drink company case competition complete deck
Create an exceptional presentation with our sales decline in a carbonated drink company case competition complete deck PowerPoint design. This informative trade reduction PPT deck gives the viewers an overview of the company as well as the past trends in the market. This retail diminishing PowerPoint layout consists of few slides that are solely dedicated to the problems and related recommendations for better operating efficiency. The competitive analysis of a certain financial year is also showcased in this fiscal decrease creative PPT set, which focuses on the possible factors and metrics responsible for the downfall. This market shrinkage PowerPoint bundle is extremely helpful as it displays effective strategies that can be adopted by the organization to upgrade their sales figures. Focus on research, hitting audience’s emotions, and launching healthy drinks are a few of the research areas in the slides of this monetary declination PPT set. Assimilate it immediately to ensure the upgrading of your figures.
Create an exceptional presentation with our sales decline in a carbonated drink company case competition complete deck Powe..
- Google Slides is a new FREE Presentation software from Google.
- All our content is 100% compatible with Google Slides.
- Just download our designs, and upload them to Google Slides and they will work automatically.
- Amaze your audience with SlideTeam and Google Slides.
-
Want Changes to This PPT Slide? Check out our Presentation Design Services
- WideScreen Aspect ratio is becoming a very popular format. When you download this product, the downloaded ZIP will contain this product in both standard and widescreen format.
-

- Some older products that we have may only be in standard format, but they can easily be converted to widescreen.
- To do this, please open the SlideTeam product in Powerpoint, and go to
- Design ( On the top bar) -> Page Setup -> and select "On-screen Show (16:9)” in the drop down for "Slides Sized for".
- The slide or theme will change to widescreen, and all graphics will adjust automatically. You can similarly convert our content to any other desired screen aspect ratio.
Compatible With Google Slides

Get This In WideScreen
You must be logged in to download this presentation.
PowerPoint presentation slides
Presenting our sales decline in a carbonated drink company case competition complete deck PowerPoint design. This PPT layout holds forty six slides and each slide is accessible in standard as well as wide-screen formats. It is completely editable as per your requirements and preferences as well. You can use it with Microsoft Office, Google slides and many other presentation software.
People who downloaded this PowerPoint presentation also viewed the following :
Content of this Powerpoint Presentation
Slide 1: This title slide introduces Sales Decline in a Carbonated Drink Company (Case Competition). Add your Company Name here.
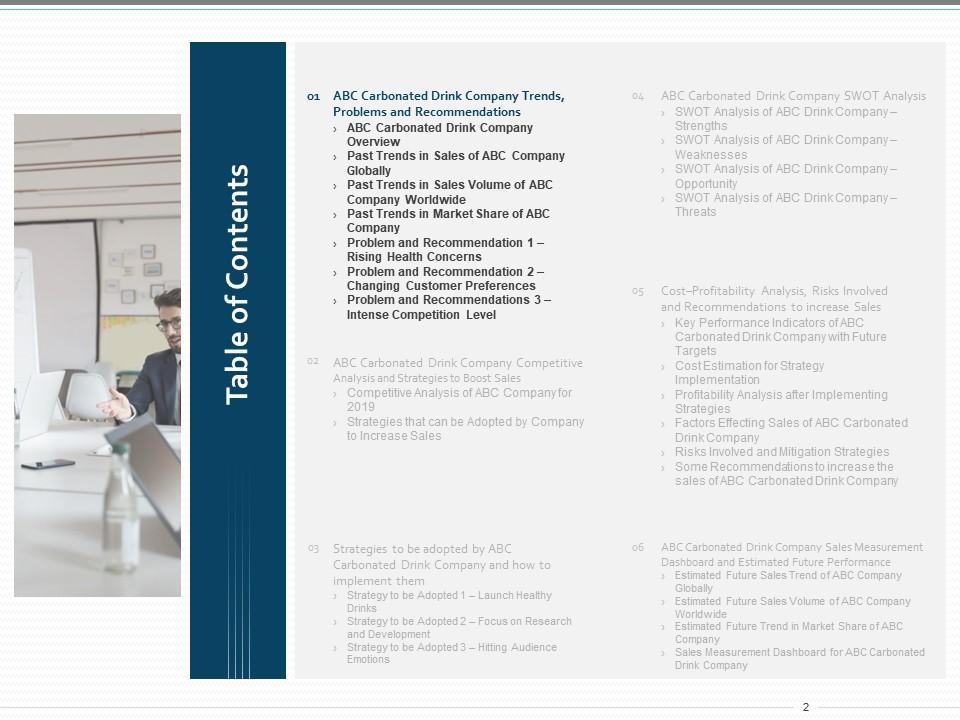
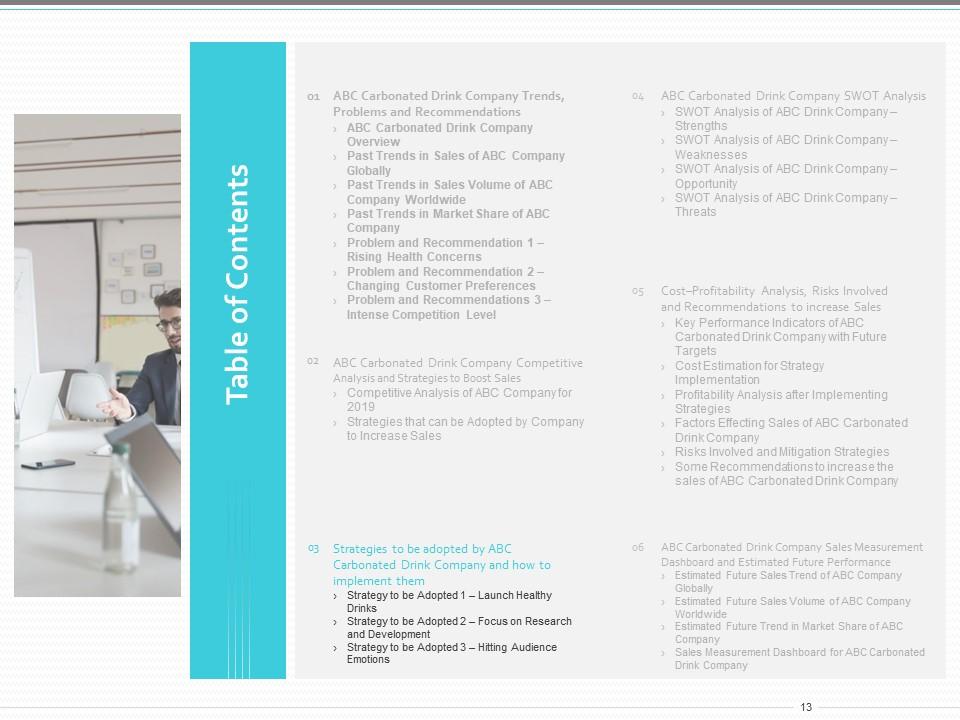
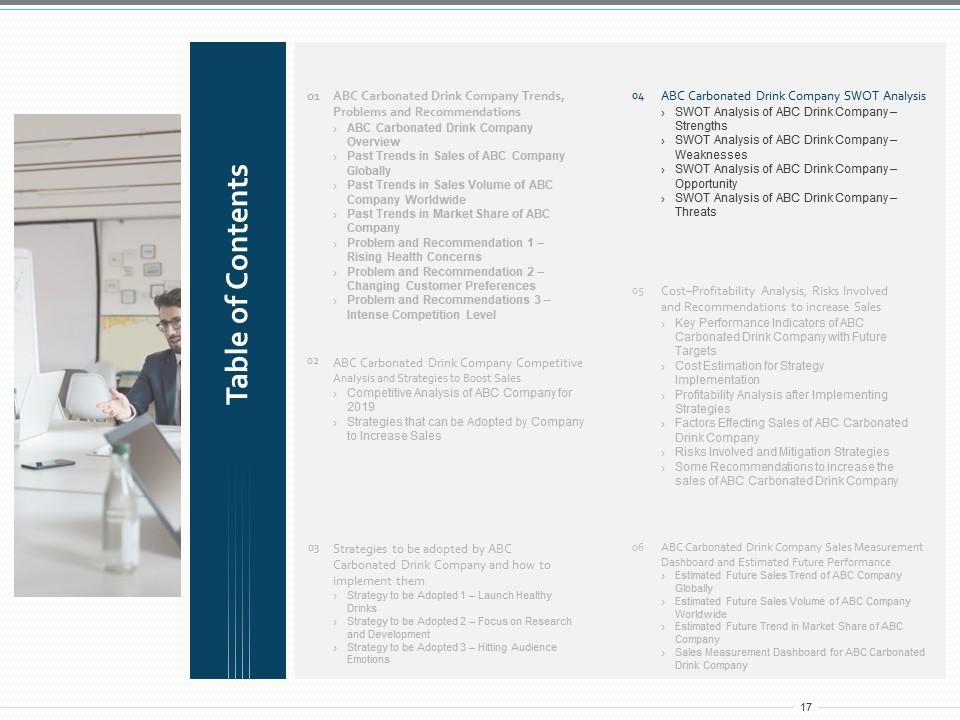
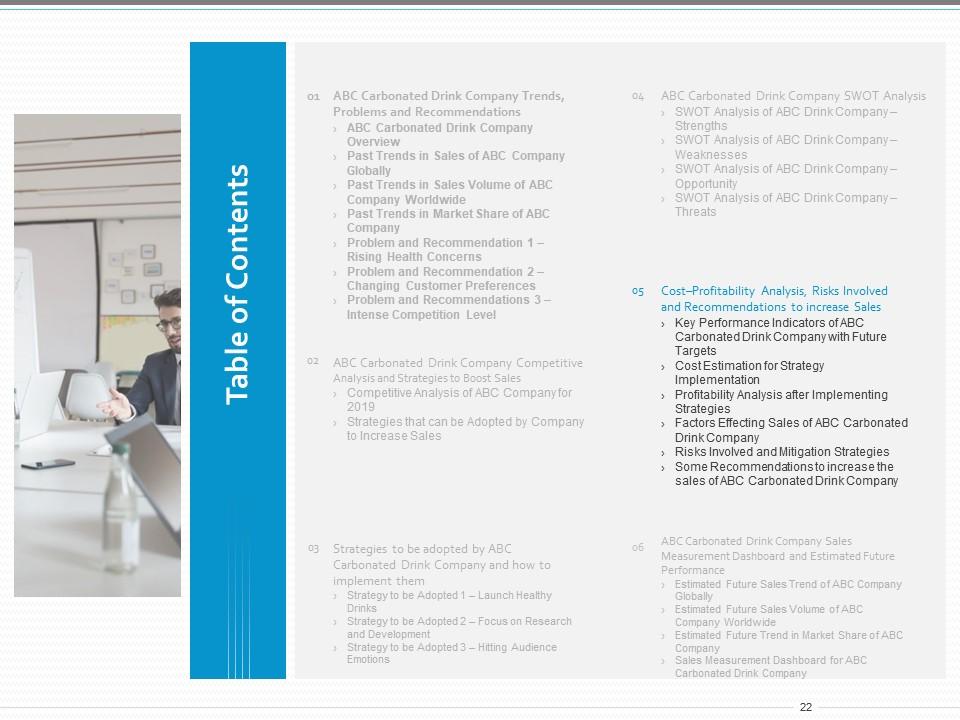
Slide 2: This slide contains the Table of Contents. The contents include ABC Carbonated Drink Company Trends (This includes ABC Carbonated Drink Company Overview, Past Trends in Sales of ABC Company Globally, Past Trends in Sales Volume of ABC Company Worldwide, Past Trends in Market Share of ABC Company, Problem and Recommendation 1 – Rising Health Concerns, Problem and Recommendation 2 – Changing Customer Preferences, Problem, and Recommendations 3 – Intense Competition Level), ABC Carbonated Drink Company Competitive Analysis and Strategies to Boost Sales, Strategies to be adopted by ABC Carbonated Drink Company and how to implement them, ABC Carbonated Drink Company SWOT Analysis, Cost–Profitability Analysis, Risks Involved and Recommendations to increase Sales and ABC Carbonated Drink Company Sales Measurement Dashboard and Estimated Future Performance
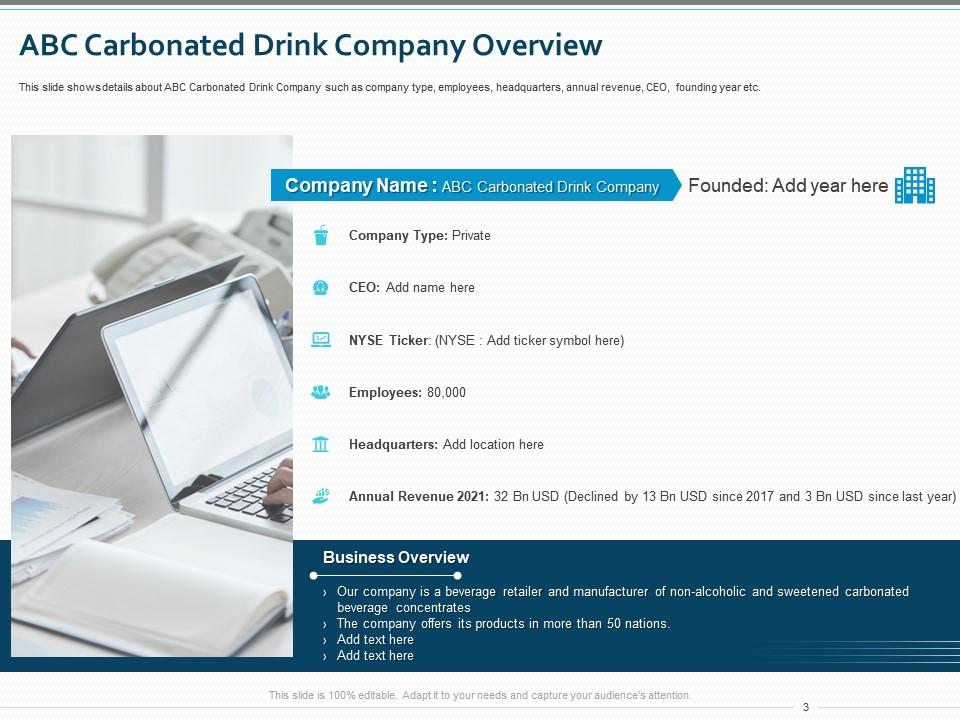
Slide 3: This slide presents the ABC Carbonated Drink Company Overview. It shows details such as company type, employees, headquarters, annual revenue, CEO, founding year, etc.
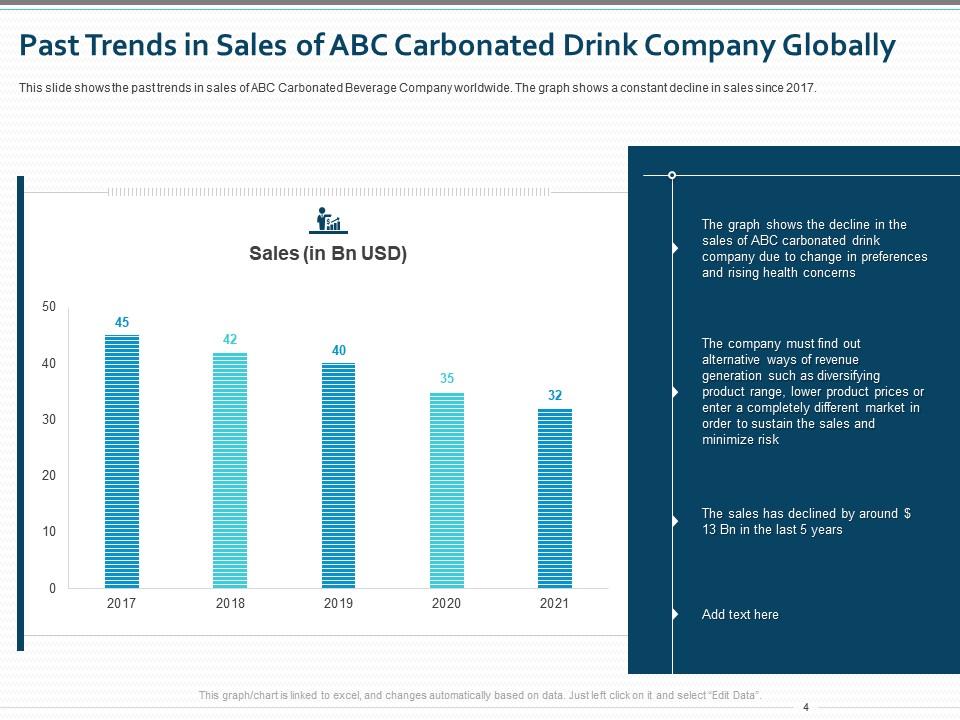
Slide 4: This slide presents the Past Trends in Sales of ABC Carbonated Drink Company Globally. The graph shows the decline in the sales of ABC carbonated drink company since 2017 due to change in preferences and rising health concerns.
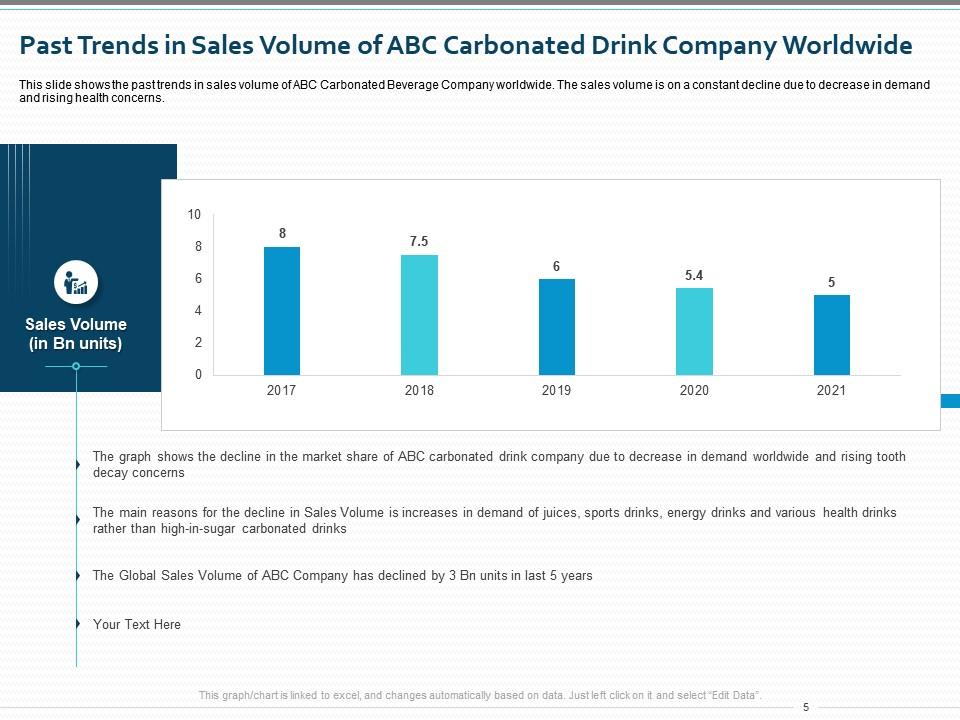
Slide 5: This slide presents the Past Trends in Sales Volume of ABC Carbonated Drink Company Worldwide. The sales volume is on a constant decline due to a decrease in demand and rising health concerns.
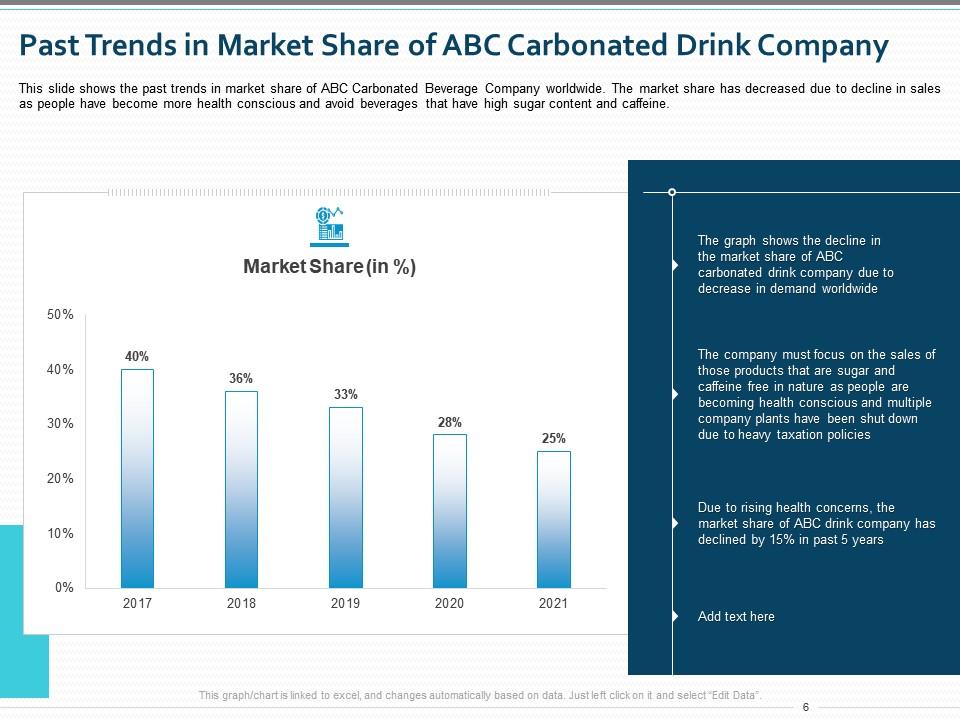
Slide 6: The slide shows Past Trends in Market Share of ABC Carbonated Drink Company. The graph shows the decline in the market share of ABC carbonated drink company due to a decrease in demand worldwide.
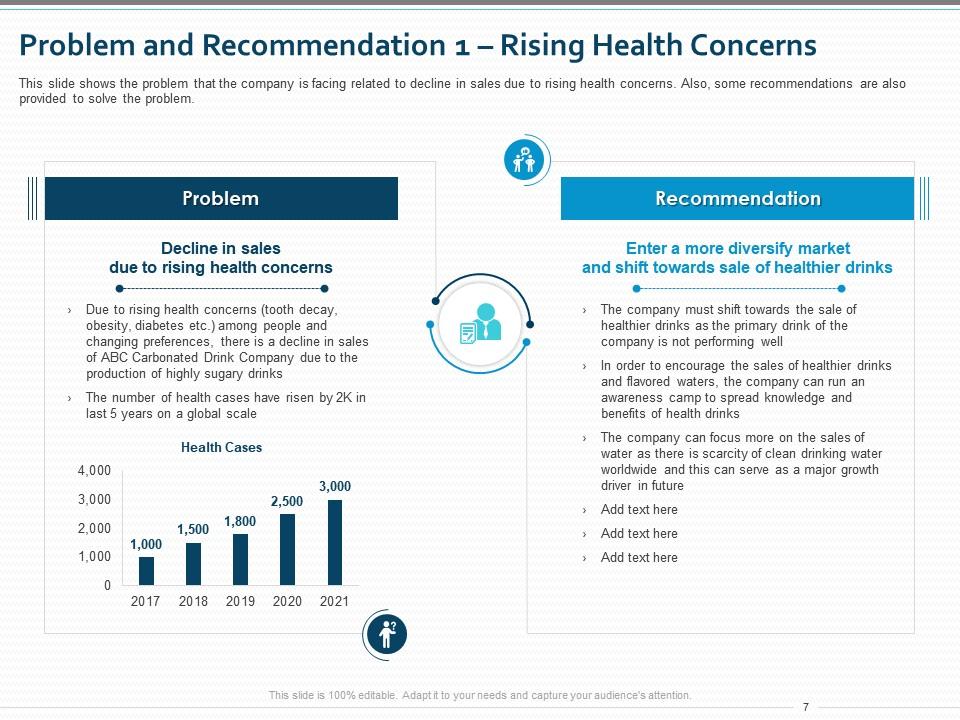
Slide 7: This slide showcases the Problem and Recommendation 1 – Rising Health Concerns. It presents the problem that the company is facing related to declining in sales due to rising health concerns. Also, some recommendations are also provided to solve the problem.
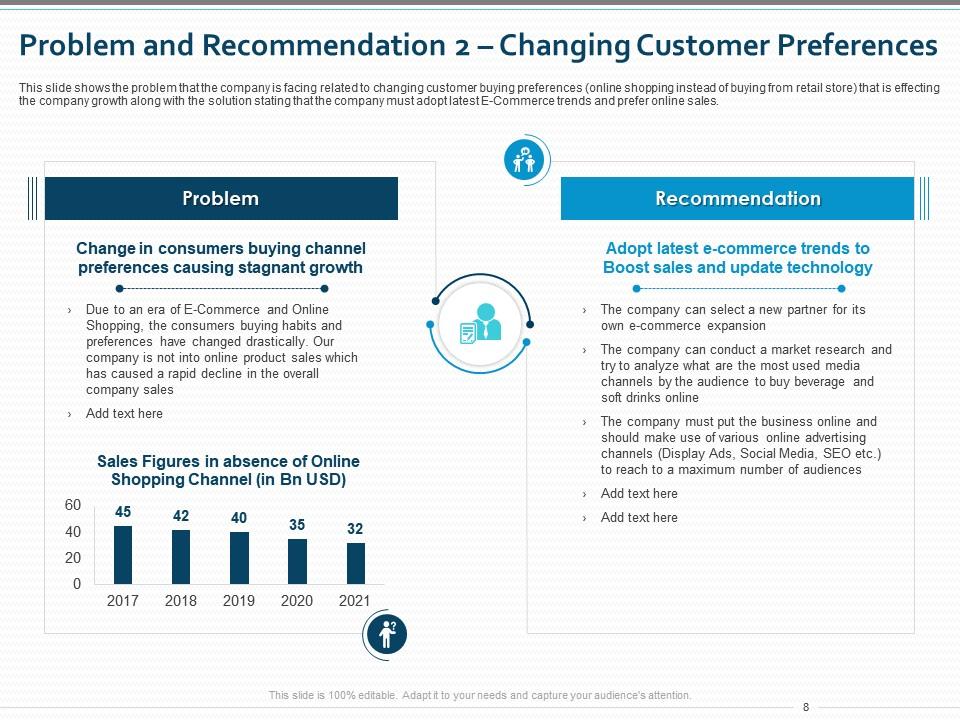
Slide 8: This slide presents the Problem and Recommendation 2 – Changing Customer Preferences. It shows the problem that the company is facing related to changing customer buying preferences (online shopping instead of buying from retail stores) that is affecting the company growth along with the solution stating that the company must adopt the latest E-Commerce trends and prefer online sales.
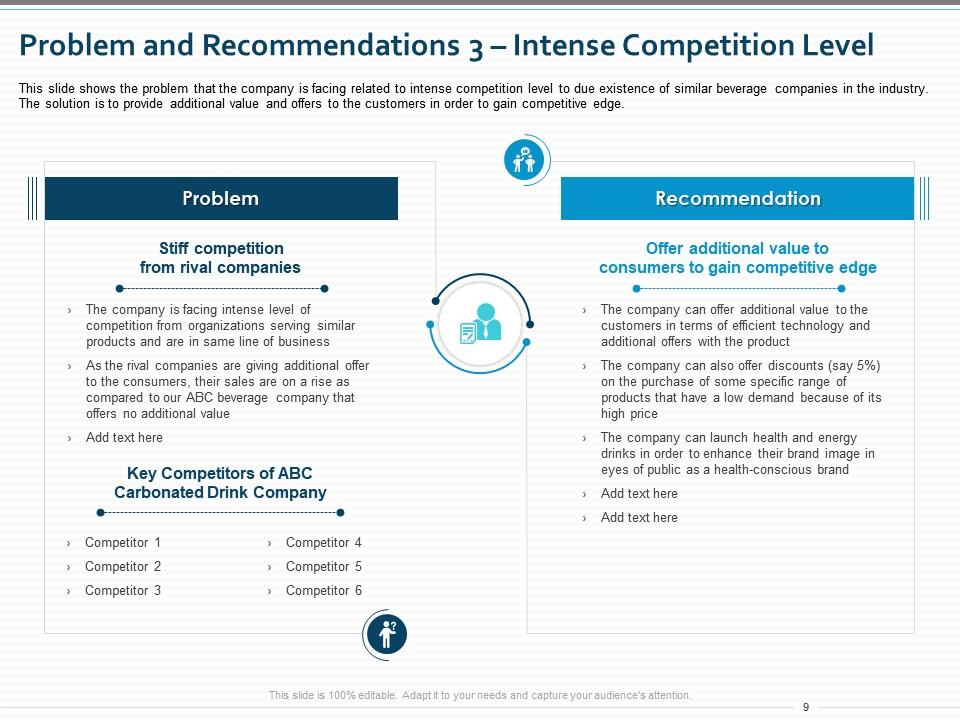
Slide 9: This slide presents the Problem and Recommendations 3 – Intense Competition Level. It shows the problem that the company is facing related to intense competition level to due to the existence of similar beverage companies in the industry. The solution is to provide additional value and offers to the customers in order to gain a competitive edge.
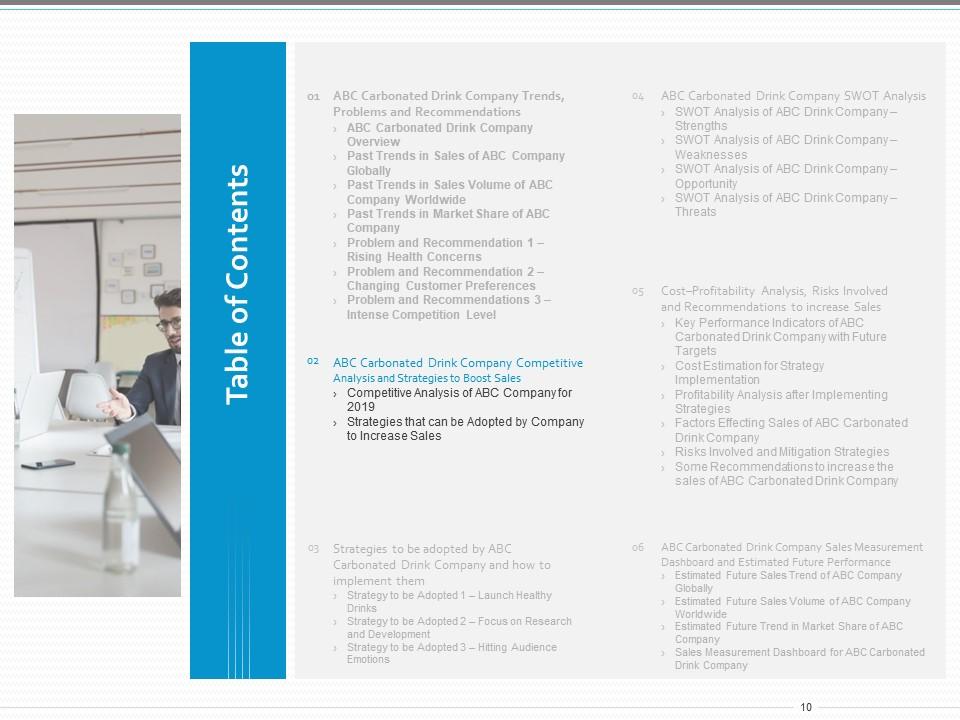
Slide 10: This slide contains the table of contents and introduces ABC Carbonated Drink Company Competitive Analysis and Strategies to Boost Sales. It includes Competitive Analysis of ABC Company for 2021 and Strategies that can be Adopted by Company to Increase Sales.
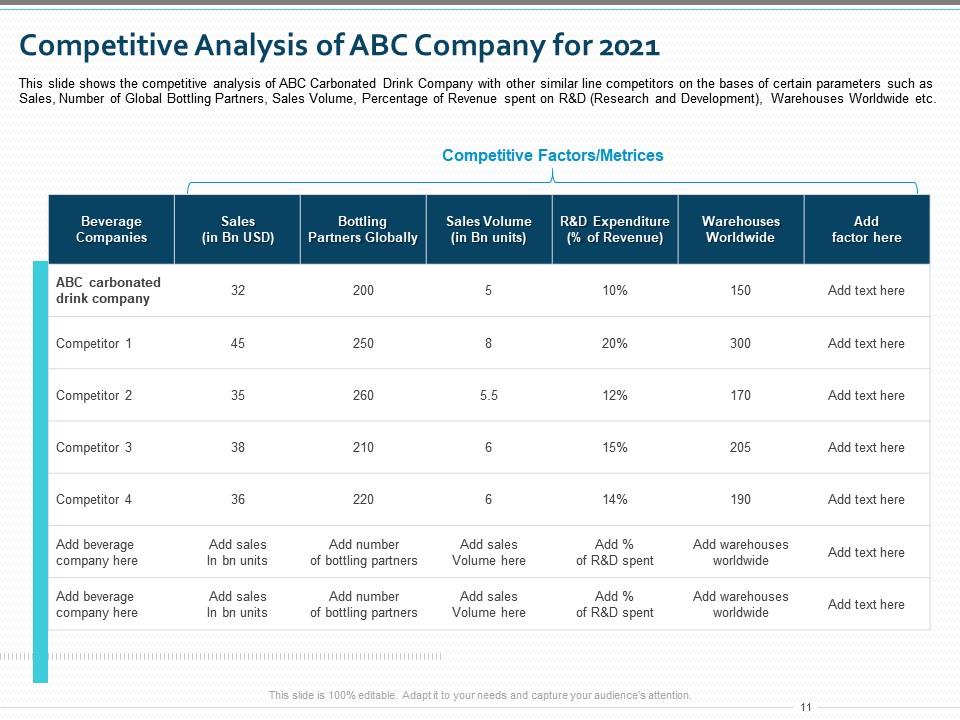
Slide 11: This slide tabulates the Competitive Analysis of ABC Company for 2021 with other similar line competitors on the basis of certain parameters such as Sales, Number of Global Bottling Partners, Sales Volume, Percentage of Revenue spent on R&D (Research and Development), Warehouses Worldwide, etc.
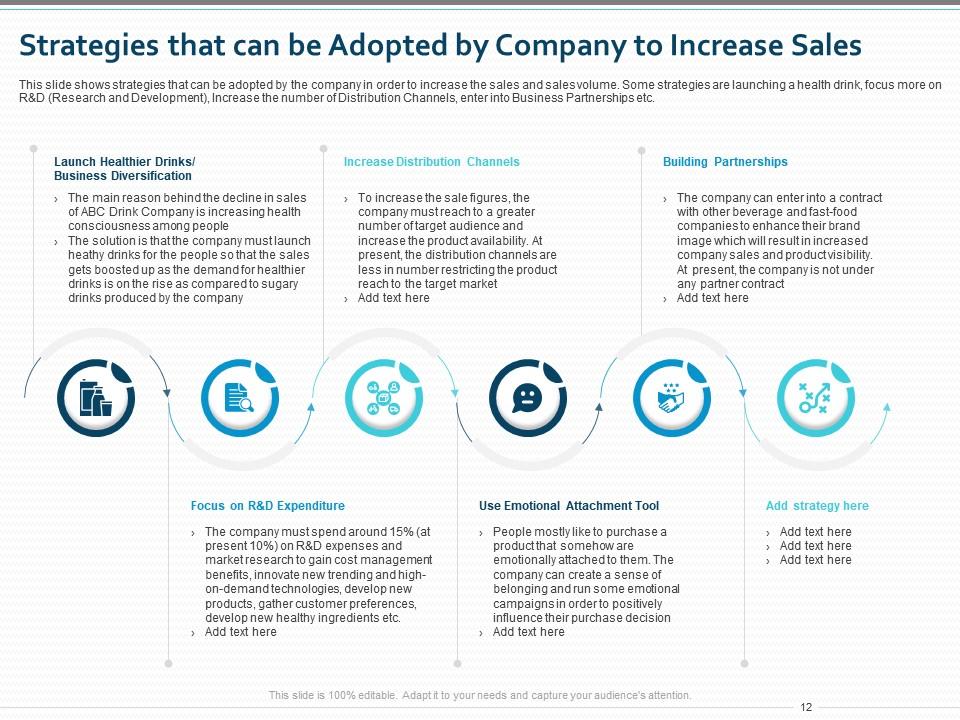
Slide 12: This slide presents the Strategies that can be Adopted by Company to Increase Sales. These strategies include launching a health drink, focusing more on R&D (Research and Development), increasing the number of Distribution Channels, enter into Business Partnerships, and using emotional attachment tools among others.
Slide 13: This slide contains the Table of Contents and introduces the Strategies to be adopted by ABC Carbonated Drink Company and how to implement them. This includes Strategy to be Adopted 1 – Launch Healthy Drinks, Strategy to be Adopted 2 – Focus on Research and Development, Strategy to be Adopted 3 – Hitting Audience Emotions.
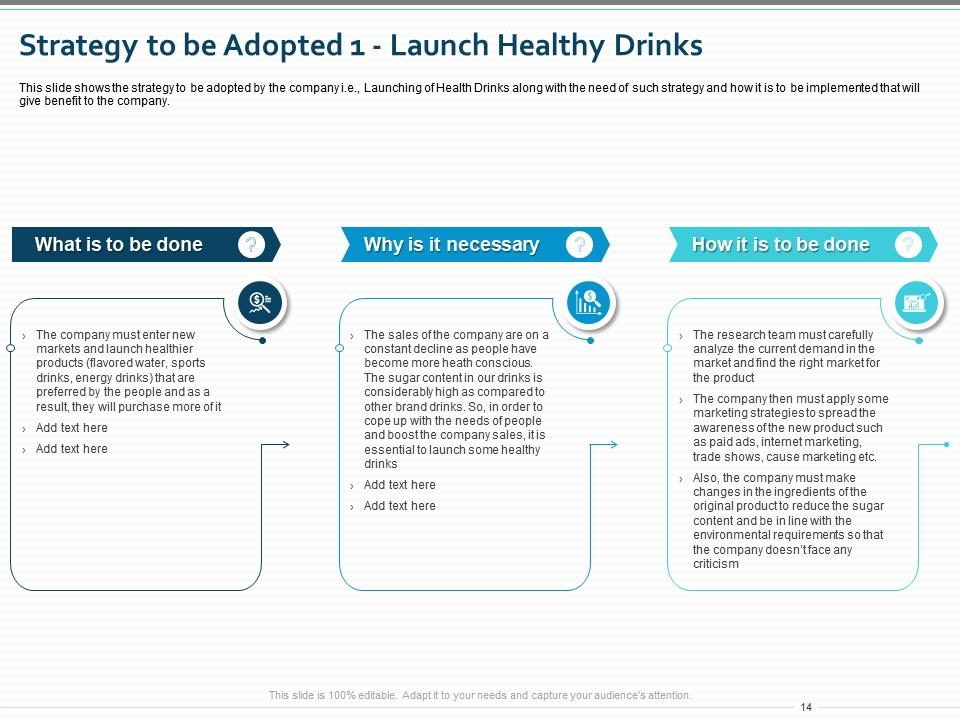
Slide 14: This slide presents the Strategy to be Adopted 1 - Launch Healthy Drinks. It provides the strategy to be adopted by the company i.e., Launching of Health Drinks along with the need for such strategy and how it is to be implemented that will give benefit to the company.
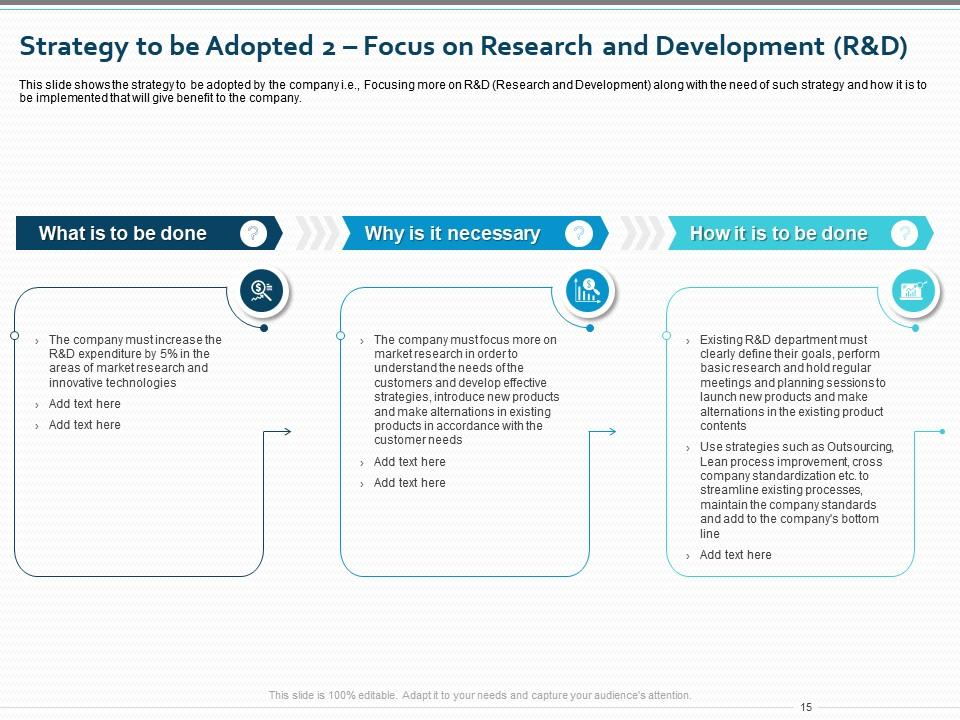
Slide 15: This slide presents the Strategy to be Adopted 2 – Focus on Research and Development (R&D). It provides the strategy to be adopted by the company i.e., Focusing more on R&D (Research and Development) along with the need for such strategy and how it is to be implemented that will give benefit to the company.
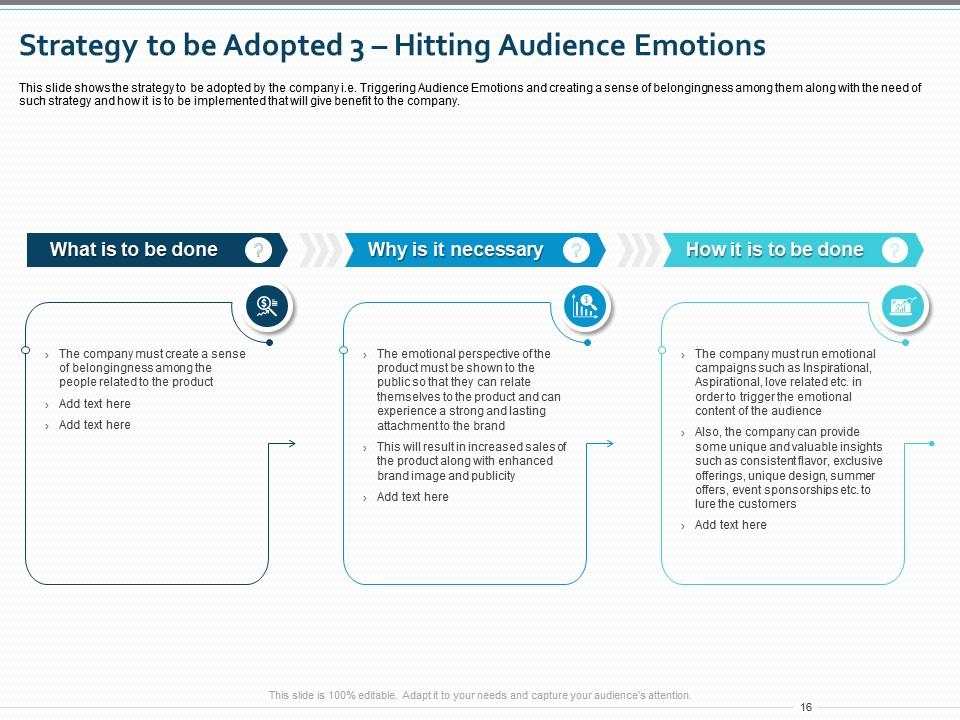
Slide 16: This slide presents the Strategy to be Adopted 3 – Hitting Audience Emotions. It provides the strategy to be adopted by the company i.e., Triggering Audience Emotions and creating a sense of belongingness among them along with the need for such strategy and how it is to be implemented that will give benefit to the company.
Slide 17: This slide contains the Table of Contents. It introduces ABC Carbonated Drink Company SWOT Analysis which includes SWOT Analysis of ABC Drink Company – Strengths, SWOT Analysis of ABC Drink Company – Weaknesses, SWOT Analysis of ABC Drink Company – Opportunity, SWOT Analysis of ABC Drink Company – Threats.
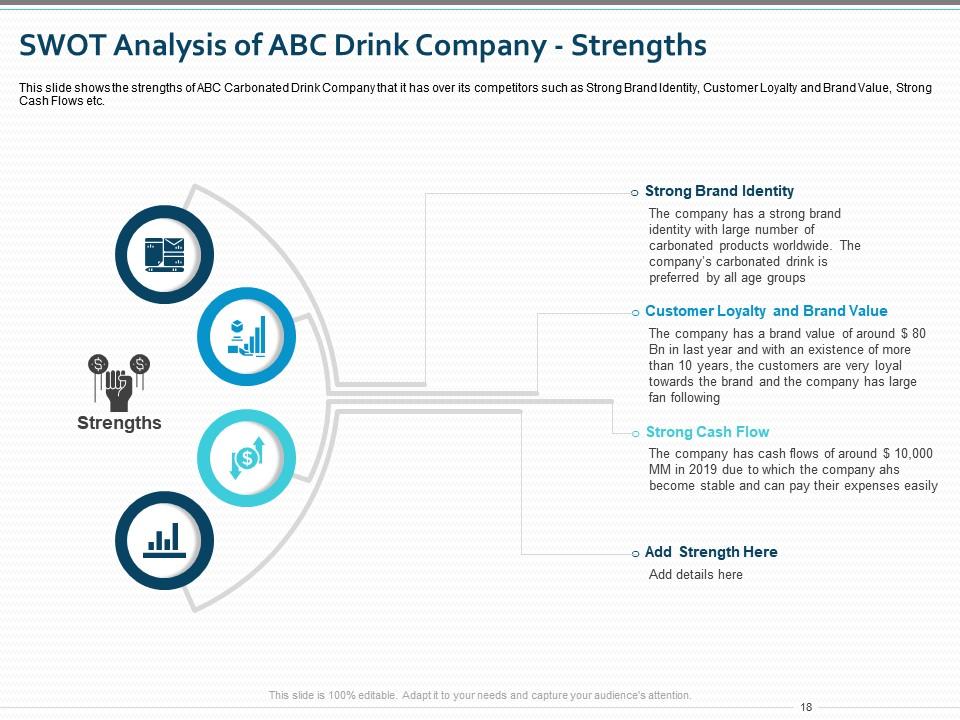
Slide 18: This slide presents the SWOT Analysis of ABC Drink Company – Strengths. It shows the strengths of ABC Carbonated Drink Company that it has over its competitors such as Strong Brand Identity, Customer Loyalty and Brand Value, Strong Cash Flows, etc.
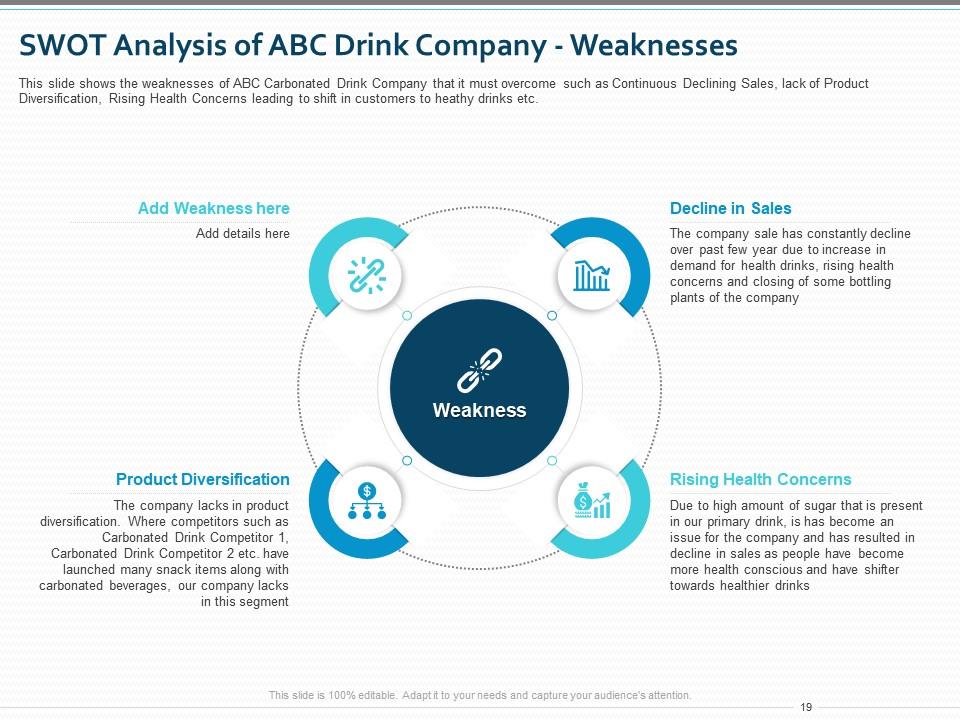
Slide 19: This slide presents the SWOT Analysis of ABC Drink Company – Weaknesses. It shows the weaknesses of ABC Carbonated Drink Company that it must overcome such as Continuous Declining Sales, lack of Product Diversification, Rising Health Concerns leading to shifting in customers to healthy drinks, etc.
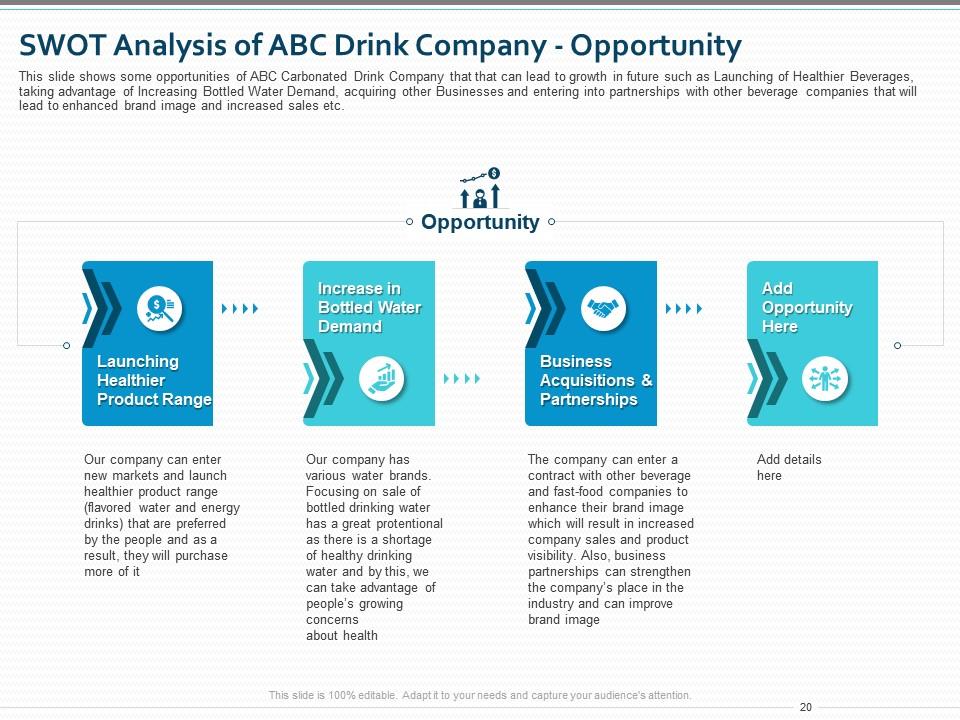
Slide 20: This slide presents the SWOT Analysis of ABC Drink Company – Opportunity. It shows some opportunities of ABC Carbonated Drink Company that can lead to growth in the future such as the Launching of Healthier Beverages, taking advantage of Increasing Bottled Water Demand, acquiring other Businesses, etc.
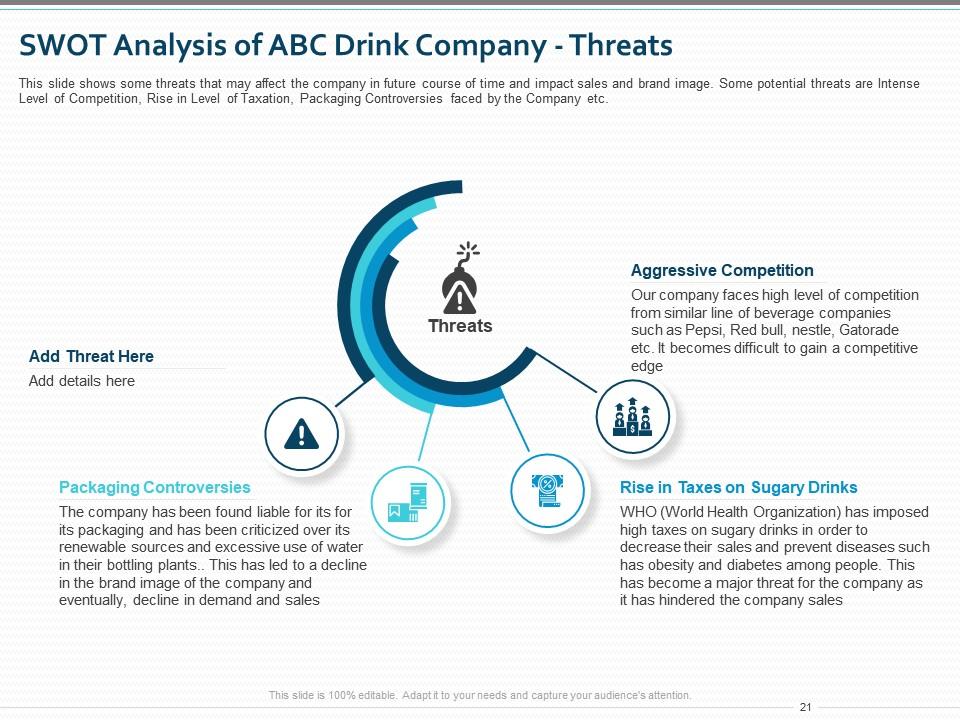
Slide 21: This slide presents the SWOT Analysis of ABC Drink Company – Threats. It shows some threats that may affect the company in the future course of time and impact sales and brand image.
Slide 22: This slide contains the Table of Contents. It introduces the Cost–Profitability Analysis, Risks Involved and Recommendations to increase Sales which includes Key Performance Indicators of ABC Carbonated Drink Company with Future Targets, Cost Estimation for Strategy Implementation, and more.
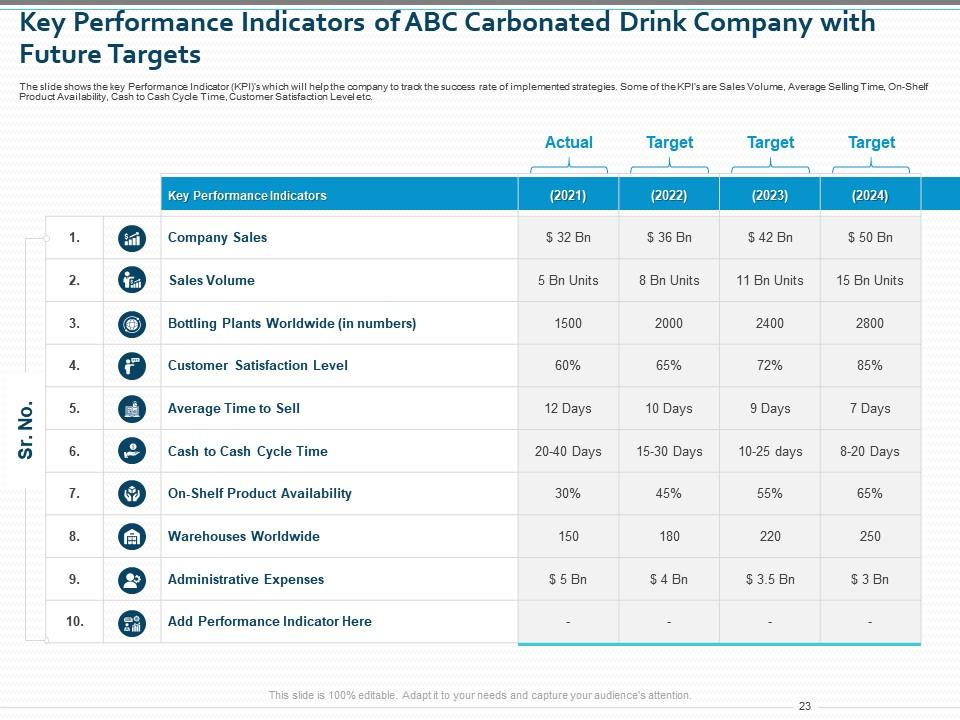
Slide 23: This slide presents the Key Performance Indicators of ABC Carbonated Drink Company with Future Targets. It shows the Key Performance Indicator (KPI)’s which will help the company to track the success rate of implemented strategies.
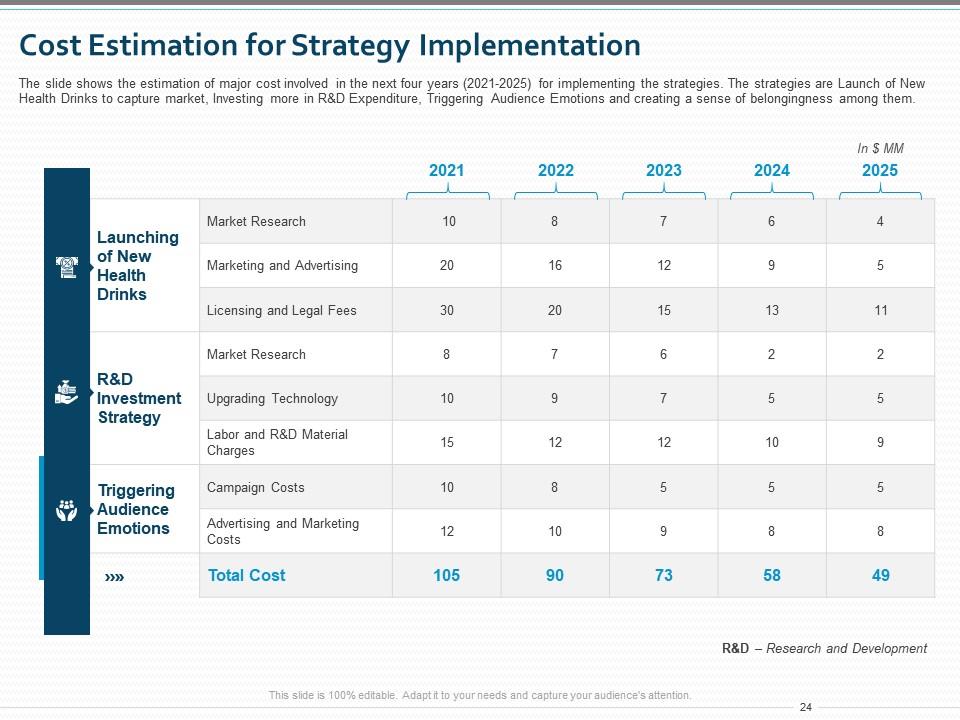
Slide 24: This slide presents the Cost Estimation for Strategy Implementation. It shows the estimation of major costs involved in the next four years (2021-2025) for implementing the strategies.
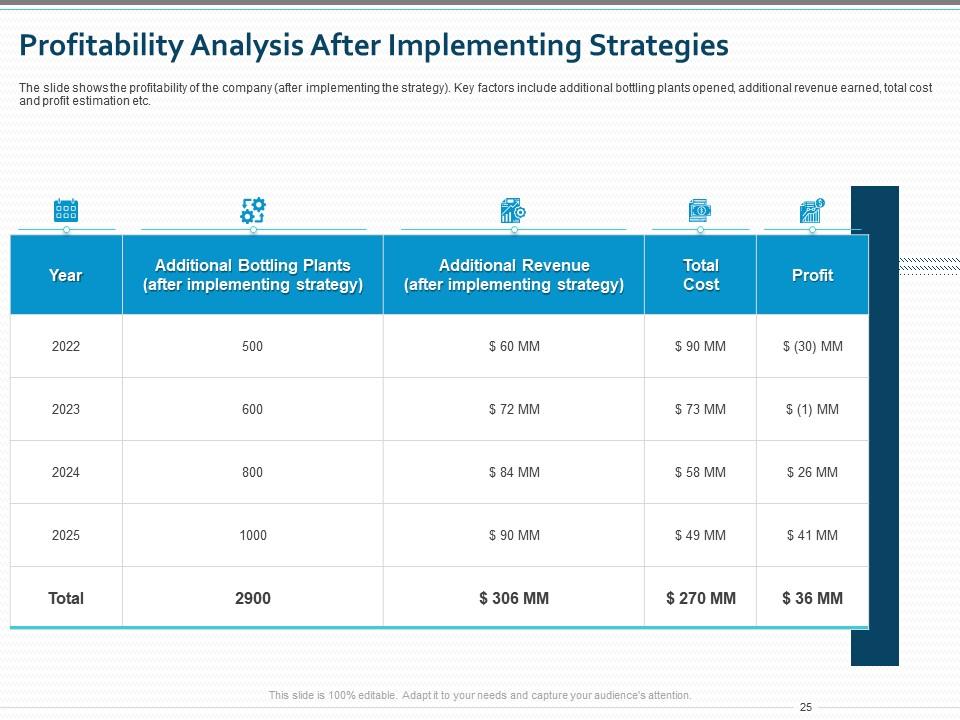
Slide 25: This slide presents the Profitability Analysis After Implementing Strategies. It shows the profitability of the company (after implementing the strategy). Key factors include additional bottling plants opened, additional revenue earned, total cost and profit estimation, etc.
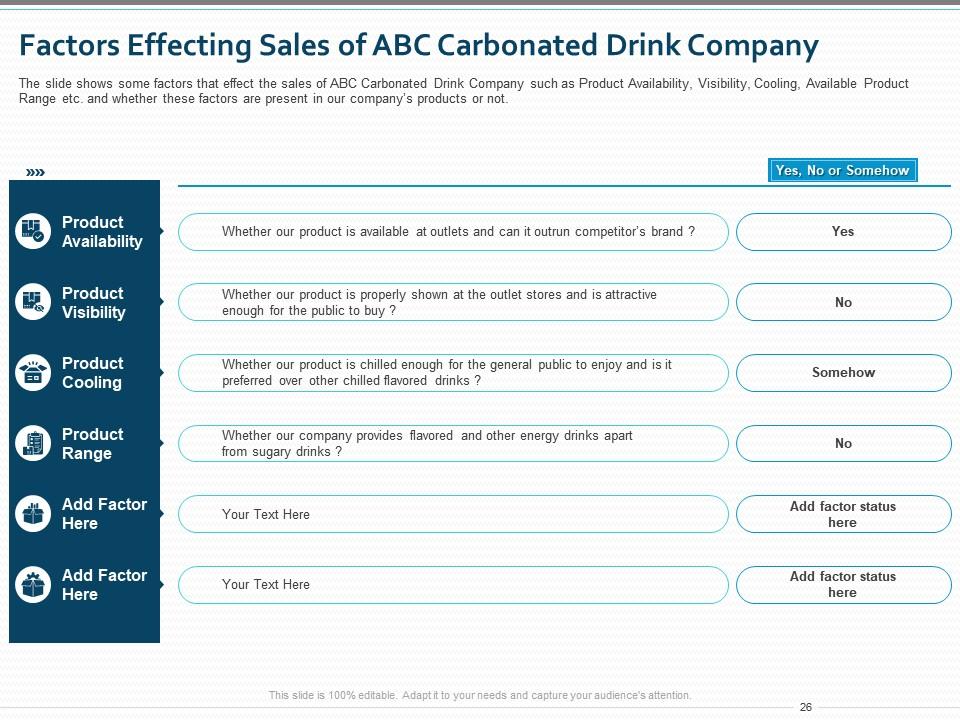
Slide 26: This slide presents the Factors Affecting Sales of ABC Carbonated Drink Company. It shows some factors that affect the sales of ABC Carbonated Drink Company such as Product Availability, Visibility, Cooling, Available Product Range, etc., and whether these factors are present in our company’s product or not.
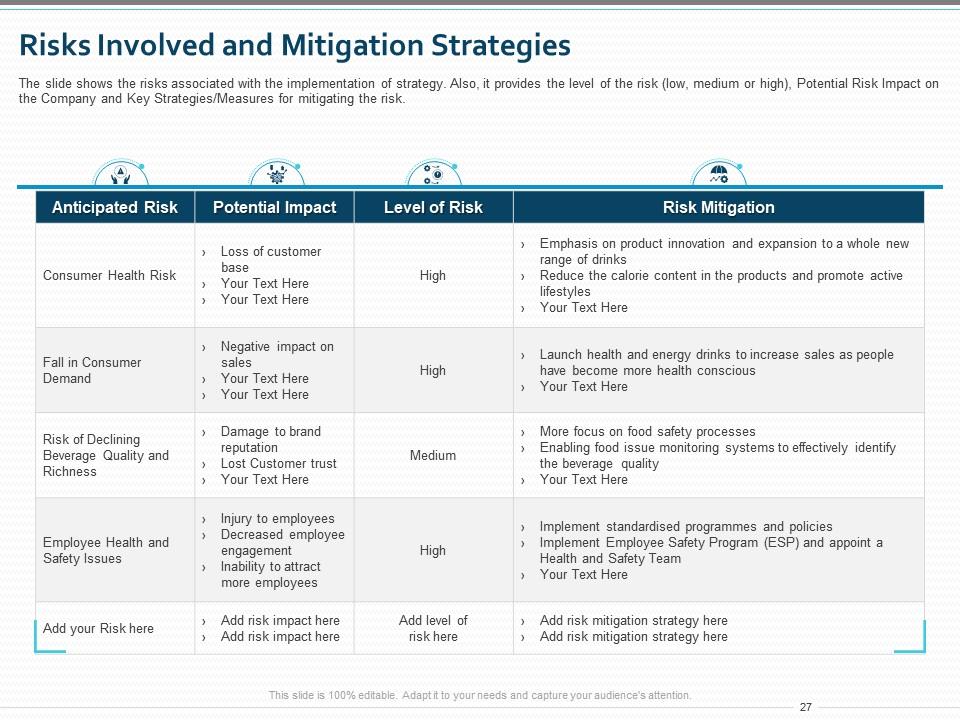
Slide 27: This slide presents the Risks Involved and Mitigation Strategies. It shows the risks associated with the implementation of the strategy. Also, it provides the level of the risk (low, medium or high), Potential Risk Impact on the Company, and Key Strategies/Measures for mitigating the risk.
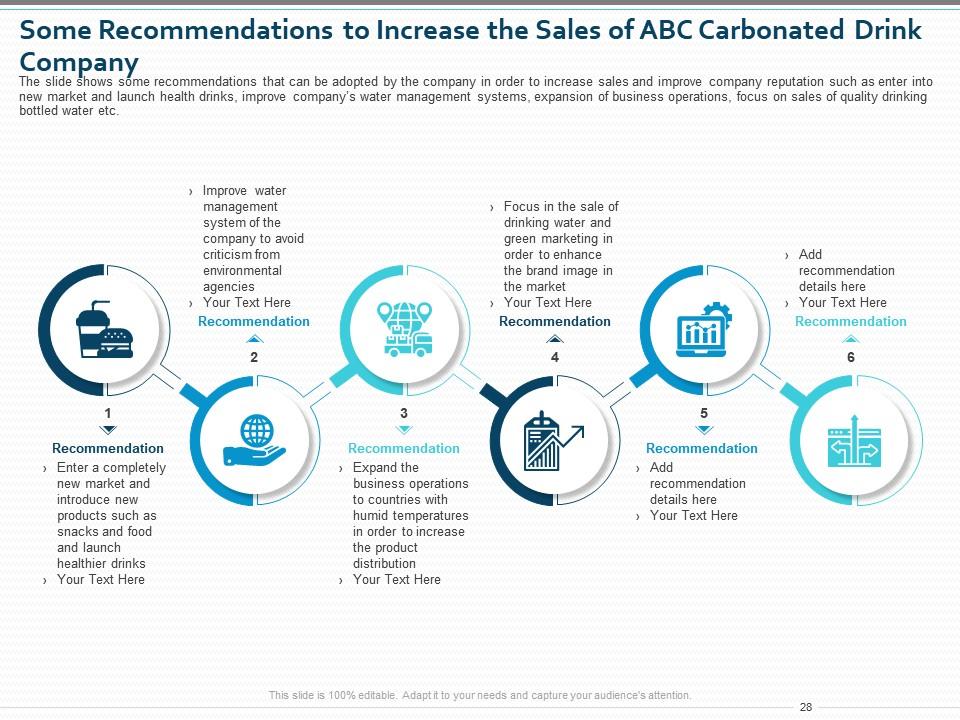
Slide 28: This slide presents Some Recommendations to Increase the Sales of ABC Carbonated Drink Company. It shows some recommendations that can be adopted by the company in order to increase sales and improve company reputation such as enter into a new market and launch health drinks, etc.
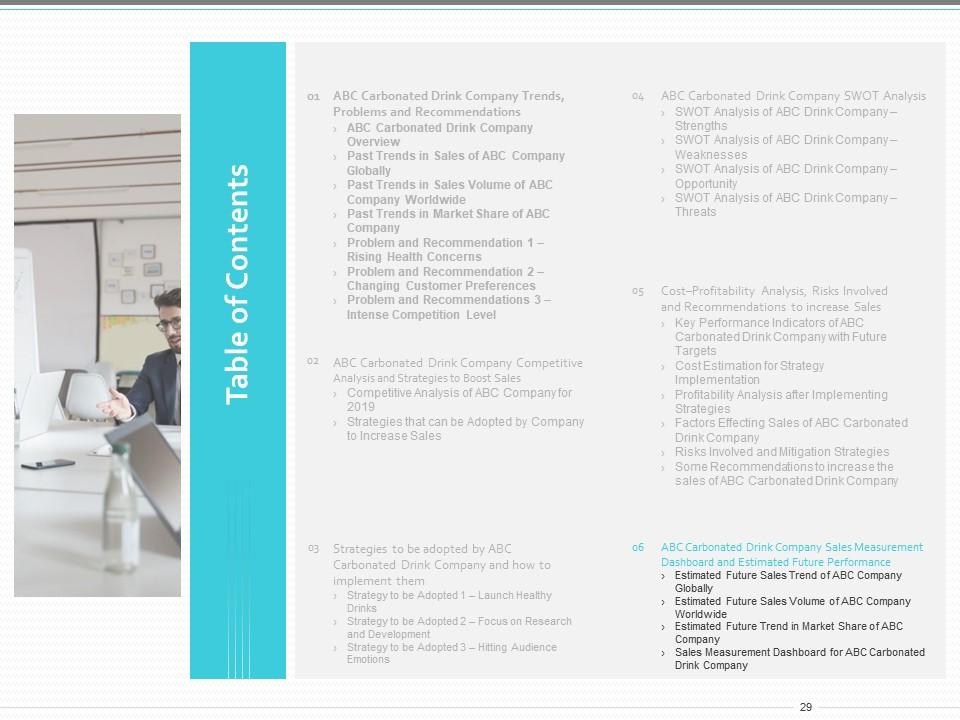
Slide 29: This slide contains the Table of Contents. It introduces ABC Carbonated Drink Company Sales Measurement Dashboard and Estimated Future Performance. It includes Estimated Future Sales Trend of ABC Company Globally, Estimated Future Sales Volume of ABC Company Worldwide, and more.
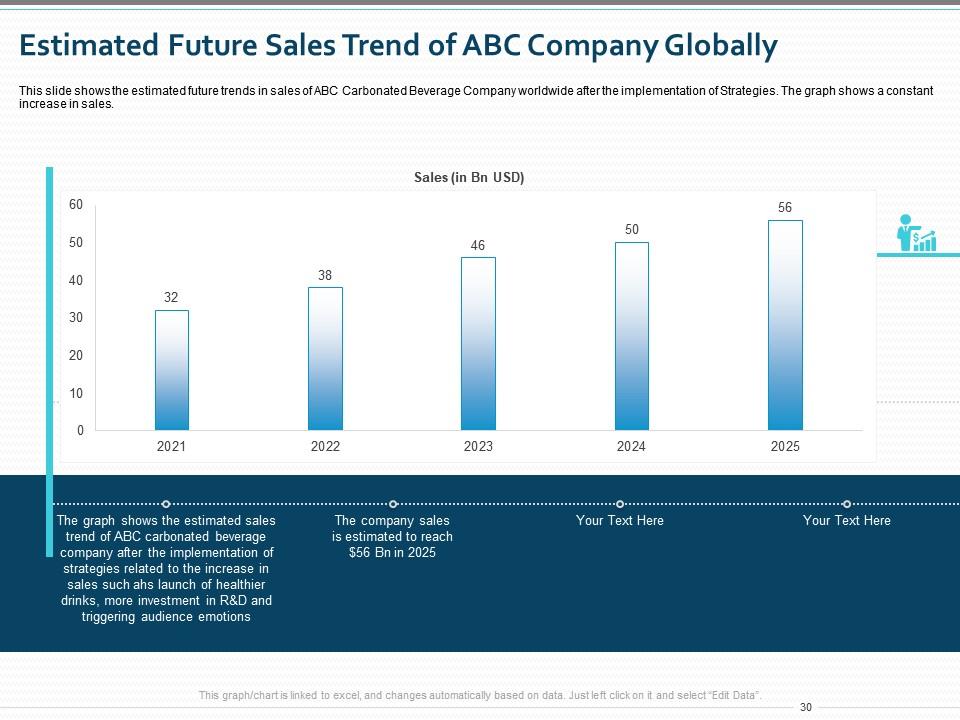
Slide 30: This slide presents the Estimated Future Sales Trend of ABC Company Globally. It shows the estimated future trends in sales of ABC Carbonated Beverage Company worldwide after the implementation of Strategies.
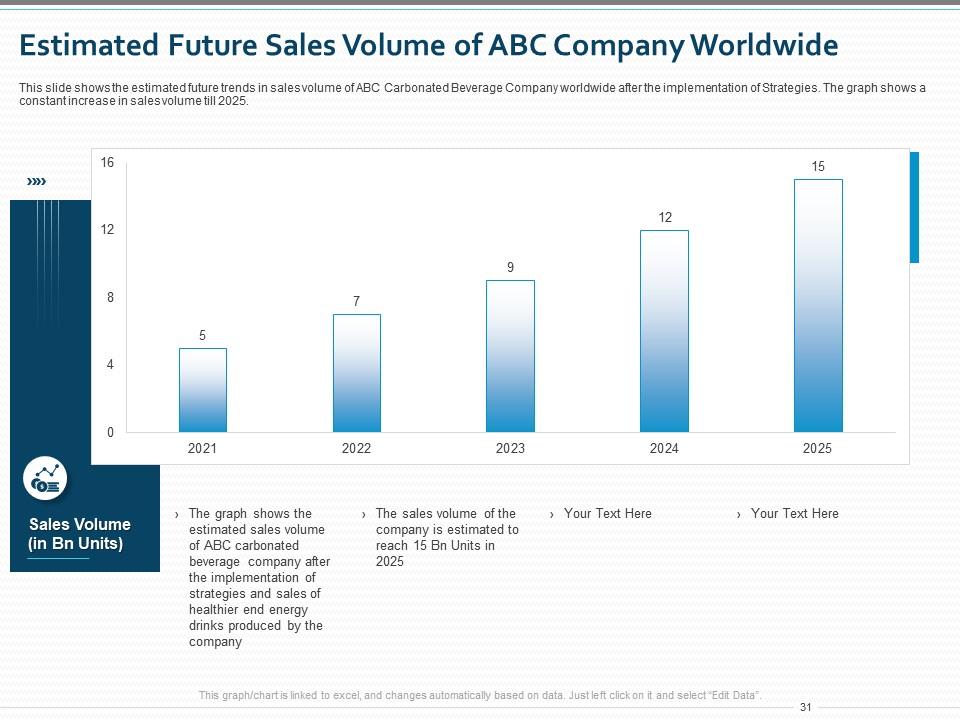
Slide 31: This slide presents the Estimated Future Sales Volume of ABC Company Worldwide. It shows the estimated future trends in sales volume of ABC Carbonated Beverage Company worldwide after the implementation of Strategies.
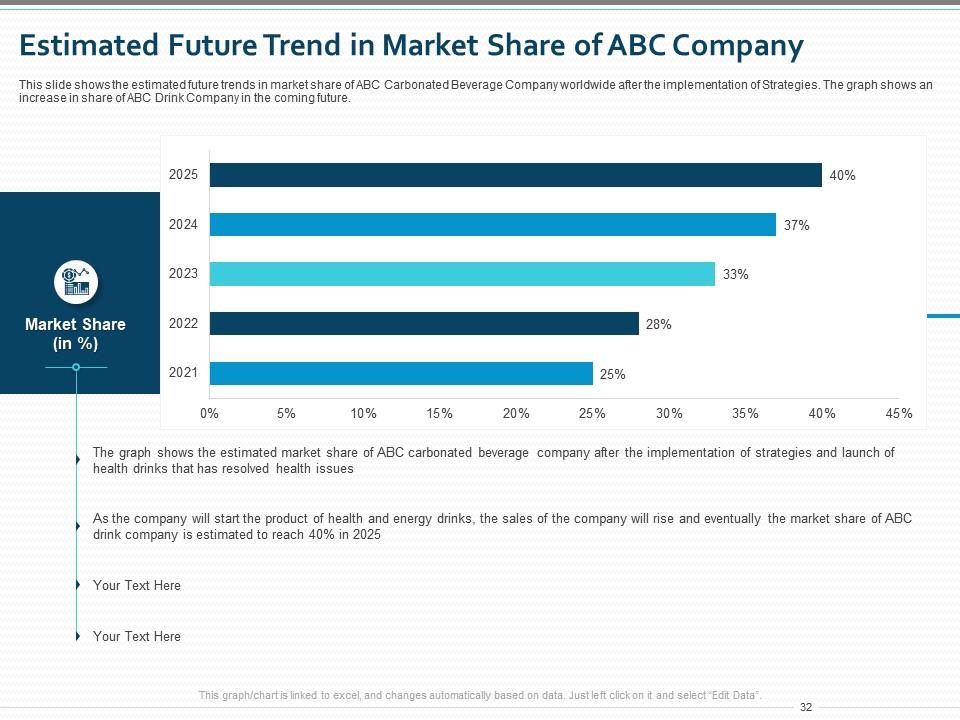
Slide 32: This slide presents the Estimated Future Trend in Market Share of ABC Company. It shows the estimated future trends in the market share of ABC Carbonated Beverage Company worldwide after the implementation of Strategies.
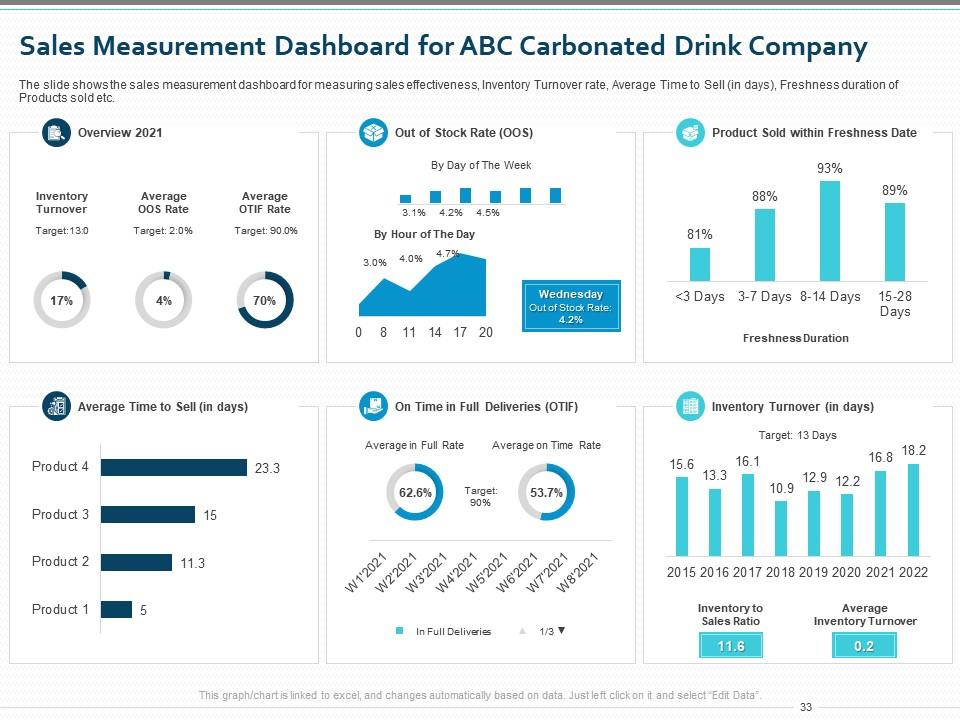
Slide 33: This slide presents the Sales Measurement Dashboard for ABC Carbonated Drink Company. It shows the sales measurement dashboard for measuring sales effectiveness, Inventory Turnover rate, Average Time to Sell (in days), the Freshness duration of Products sold, etc.
Slide 34: This slide contains a number of Case Competition - Sales Decline in Carbonated Drink Company Icons Slide for you to choose from.
Slide 35: This slide introduces the Additional Slides
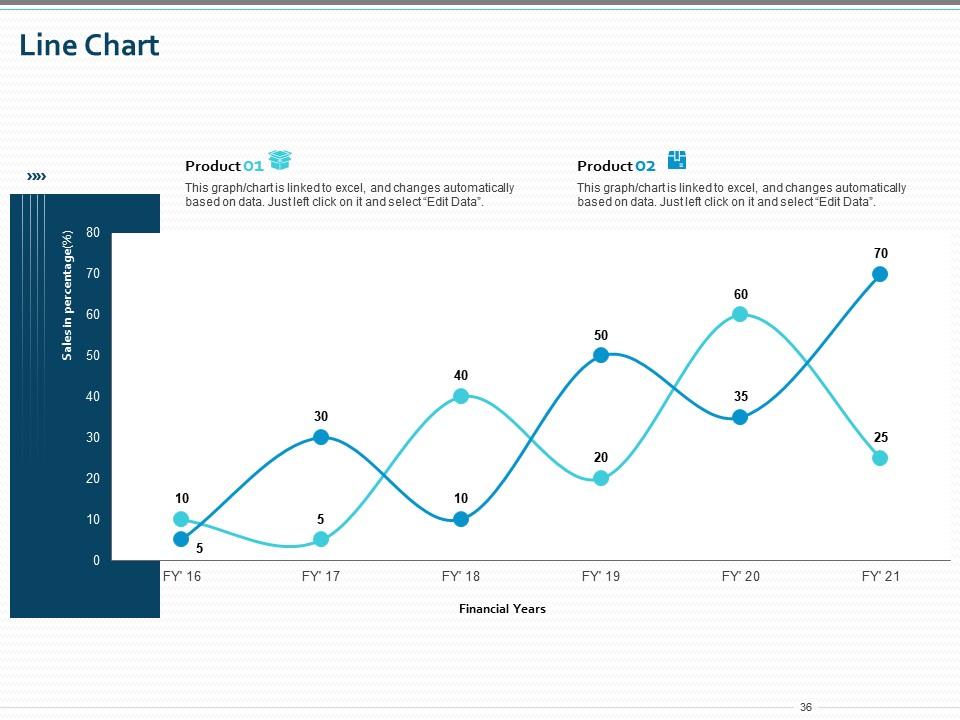
Slide 36: This slide shows an editable Line Chart comparing a change in two products over a period of several years.
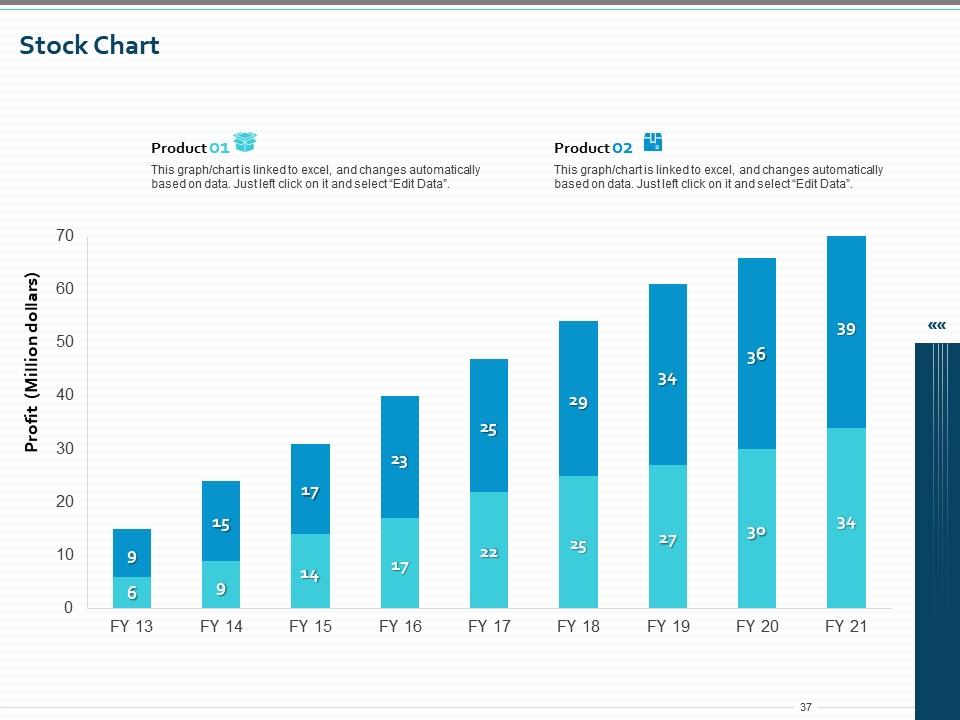
Slide 37: This slide presents the Stock Chart comparing a change in two products over a period of several years.
Slide 38: This slide shows the members of the company team with their name, designation, and photo.
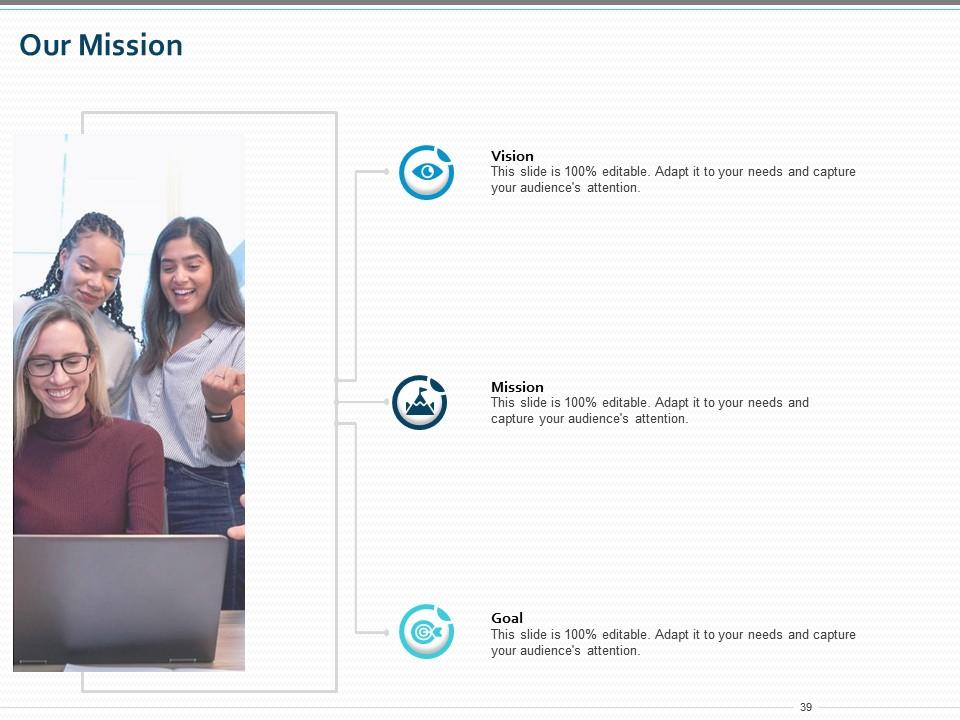
Slide 39: This slide provides the Mission for the entire company. This includes the vision, the mission, and the goal.
Slide 40: This slide contains the information about the company aka the ‘About Us’ section. This includes the Professional, Creative, and Talented.
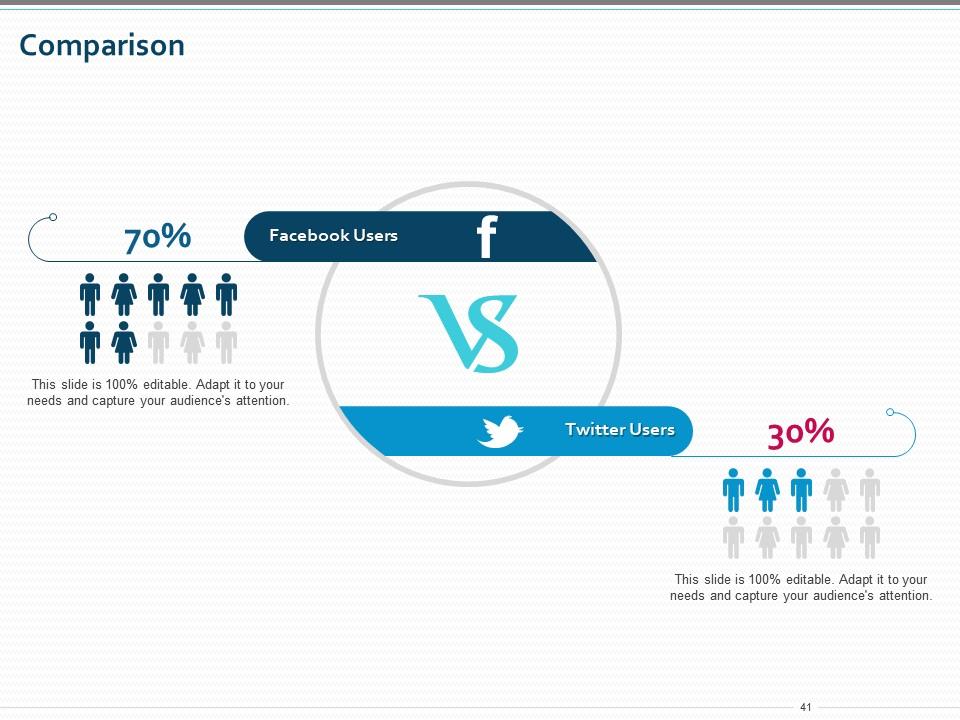
Slide 41: This slide presents the comparison of the number of users on Facebook and Twitter.
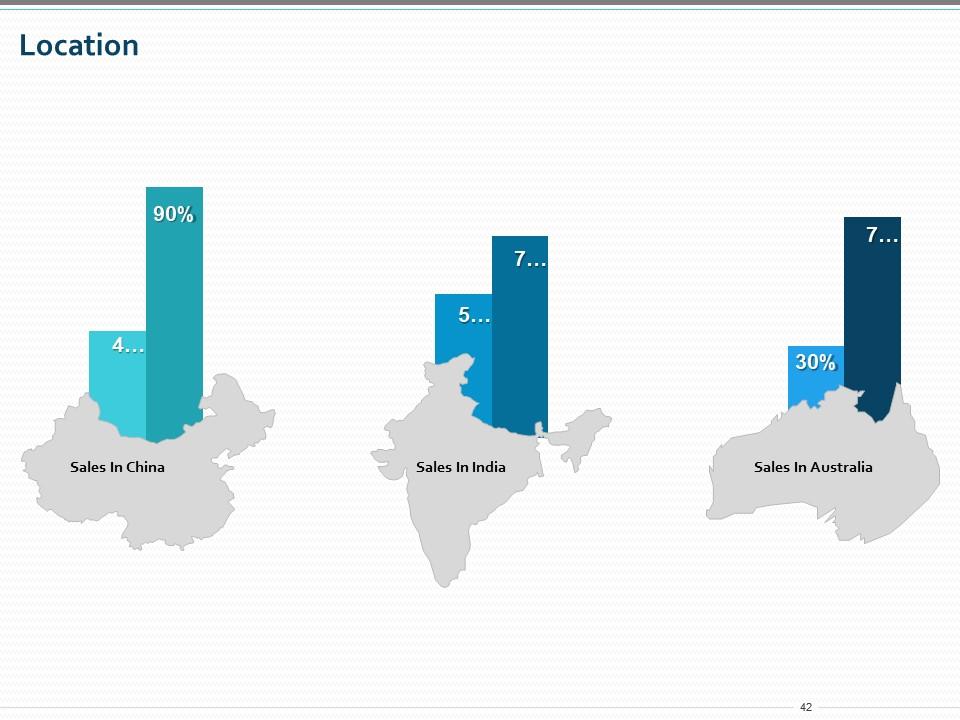
Slide 42: This slide shows the sales in different locations such as China, India, and Australia.
Slide 43: This is a slide with a 30 60 90 Days Plan to set goals for these important intervals.
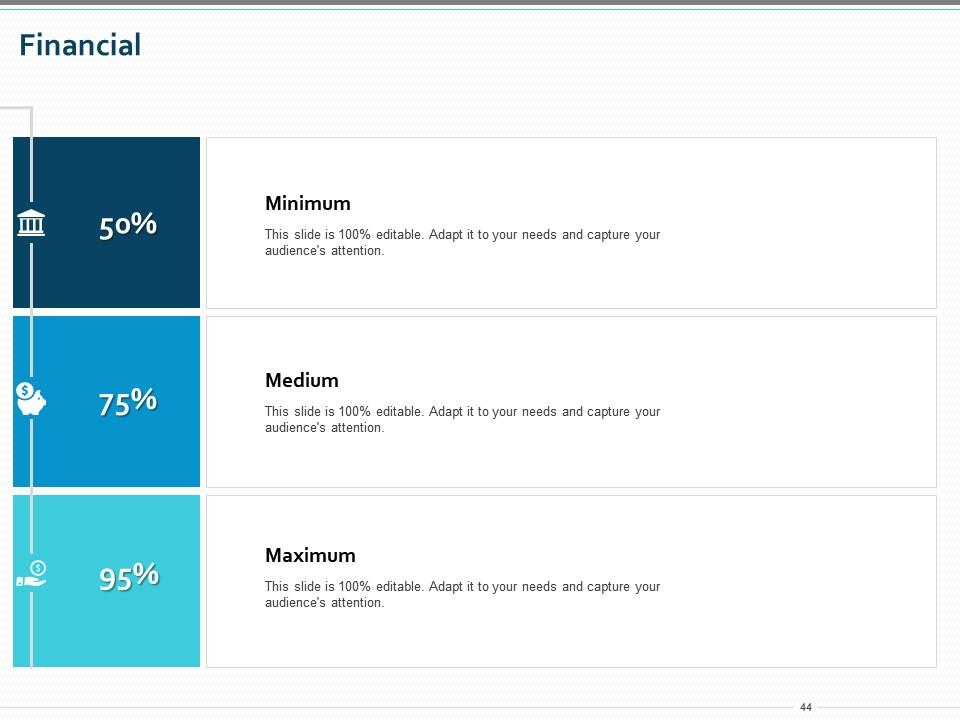
Slide 44: This is a financial presentation template. It can be used to represent market value in different markets from the minimum to the maximum.
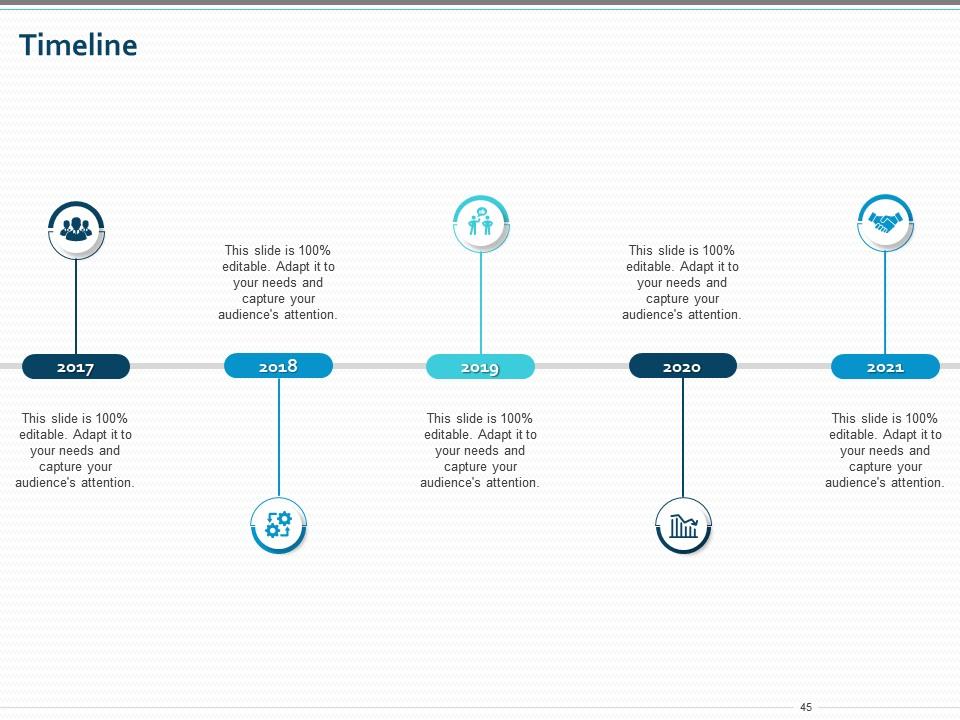
Slide 45: This slide is a Timeline template to showcase the progress of the steps of a project with time.
Slide 46: This is a Thank You slide where details such as the address, contact number, email address are added.
Sales decline in a carbonated drink company case competition complete deck with all 46 slides:
Use our Sales Decline In A Carbonated Drink Company Case Competition Complete Deck to effectively help you save your valuable time. They are readymade to fit into any presentation structure.
-
Informative design.
-
Informative design.
-
Very well designed and informative templates.
-
Excellent products for quick understanding.
-
Awesome presentation, really professional and easy to edit.
-
Unique design & color.
-
Topic best represented with attractive design.
-
Presentation Design is very nice, good work with the content as well.
-
Easily Understandable slides.


