SAP Analytics Cloud Dashboard For Financial Reporting Business Intelligence Strategy For Data Driven Decisions
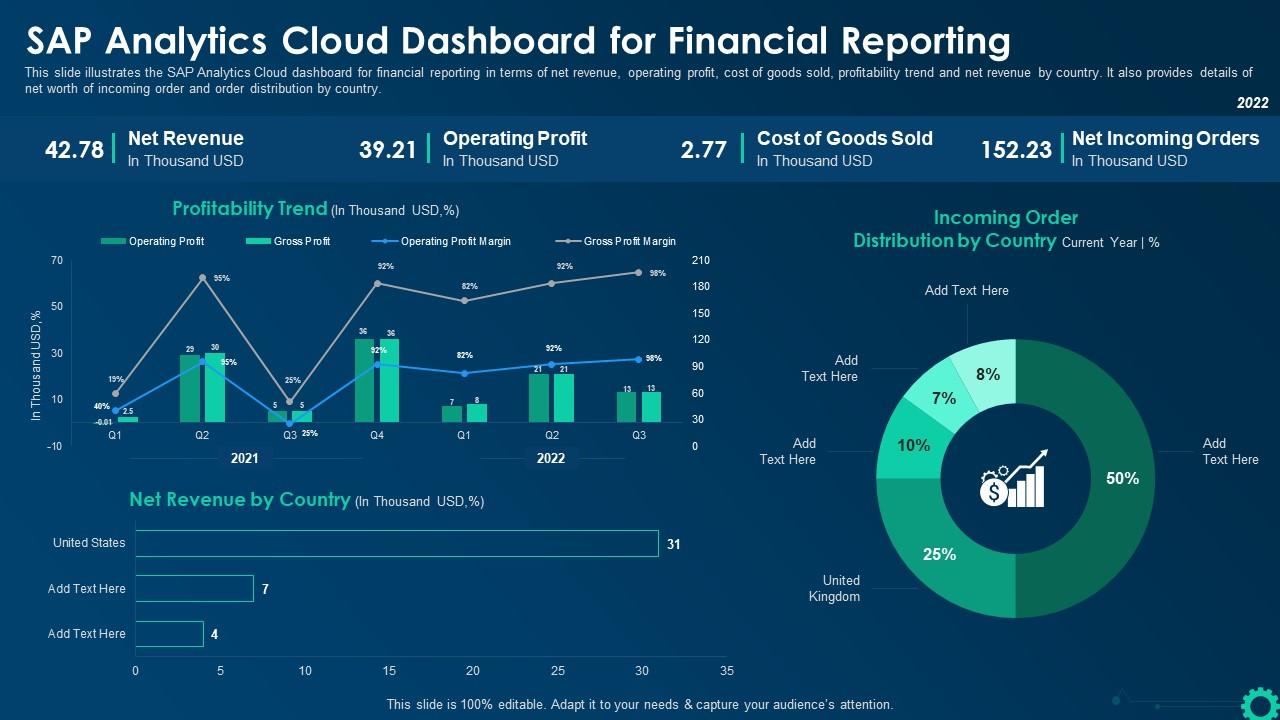
This slide illustrates the SAP Analytics Cloud dashboard for financial reporting in terms of net revenue, operating profit, cost of goods sold, profitability trend and net revenue by country. It also provides details of net worth of incoming order and order distribution by country.
This slide illustrates the SAP Analytics Cloud dashboard for financial reporting in terms of net revenue, operating profit,..
- Google Slides is a new FREE Presentation software from Google.
- All our content is 100% compatible with Google Slides.
- Just download our designs, and upload them to Google Slides and they will work automatically.
- Amaze your audience with SlideTeam and Google Slides.
-
Want Changes to This PPT Slide? Check out our Presentation Design Services
- WideScreen Aspect ratio is becoming a very popular format. When you download this product, the downloaded ZIP will contain this product in both standard and widescreen format.
-

- Some older products that we have may only be in standard format, but they can easily be converted to widescreen.
- To do this, please open the SlideTeam product in Powerpoint, and go to
- Design ( On the top bar) -> Page Setup -> and select "On-screen Show (16:9)” in the drop down for "Slides Sized for".
- The slide or theme will change to widescreen, and all graphics will adjust automatically. You can similarly convert our content to any other desired screen aspect ratio.
Compatible With Google Slides

Get This In WideScreen
You must be logged in to download this presentation.
PowerPoint presentation slides
This slide illustrates the SAP Analytics Cloud dashboard for financial reporting in terms of net revenue, operating profit, cost of goods sold, profitability trend and net revenue by country. It also provides details of net worth of incoming order and order distribution by country. Present the topic in a bit more detail with this SAP Analytics Cloud Dashboard For Financial Reporting Business Intelligence Strategy For Data Driven Decisions. Use it as a tool for discussion and navigation on Operating Profit, Net Incoming Orders, Profitability Trend, Financial Reporting. This template is free to edit as deemed fit for your organization. Therefore download it now.
People who downloaded this PowerPoint presentation also viewed the following :
SAP Analytics Cloud Dashboard For Financial Reporting Business Intelligence Strategy For Data Driven Decisions with all 7 slides:
Use our SAP Analytics Cloud Dashboard For Financial Reporting Business Intelligence Strategy For Data Driven Decisions to effectively help you save your valuable time. They are readymade to fit into any presentation structure.
-
The Designed Graphic are very professional and classic.
-
Easily Editable.


