


Sdn Controller Dashboard For Software Defined Networking Sdn




Try Before you Buy Download Free Sample Product
 Impress Your
Audience
 100%
Editable
 Save Hours
of Time


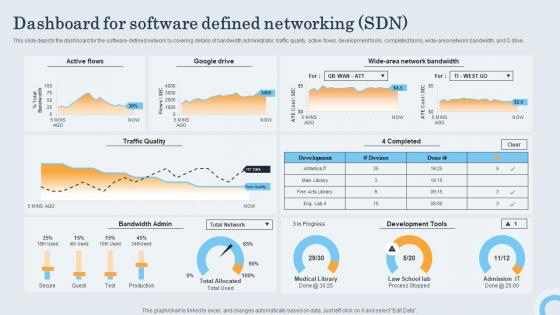
This slide depicts the dashboard for the software defined network by covering details of bandwidth administrator, traffic quality, active flows, development tools, completed tasks, wide area network bandwidth, and G drive.
People who downloaded this PowerPoint presentation also viewed the following :
Sdn Controller Dashboard For Software Defined Networking Sdn with all 7 slides:
Use our Sdn Controller Dashboard For Software Defined Networking Sdn to effectively help you save your valuable time. They are readymade to fit into any presentation structure.







FAQs for Sdn Controller Dashboard For Software
Effective SDN controller dashboards include real-time network topology visualization, centralized policy management, traffic flow monitoring, performance analytics, and automated troubleshooting capabilities. These features streamline network operations by providing comprehensive visibility, enabling proactive management, and reducing response times, with many enterprises finding that integrated dashboards ultimately deliver enhanced operational efficiency and significantly improved network reliability.
Real-time monitoring enhances SDN network performance by providing instant visibility into traffic patterns, resource utilization, and potential bottlenecks, enabling immediate optimization decisions. Through centralized dashboards, network administrators can dynamically adjust bandwidth allocation, reroute traffic around congested areas, and proactively address issues before they impact users, ultimately delivering faster response times and improved reliability.
Essential SDN controller dashboard metrics include network topology visualization, traffic flow patterns, bandwidth utilization rates, latency measurements, controller performance statistics, and security event logs. These metrics enhance network management by enabling real-time monitoring, predictive maintenance, and rapid issue resolution, with many organizations finding that comprehensive visibility ultimately delivers improved operational efficiency and reduced network downtime.
SDN controller dashboards facilitate troubleshooting by providing centralized network visibility, real-time traffic monitoring, automated alert systems, and comprehensive topology mapping. Through intuitive interfaces, network administrators can quickly identify bottlenecks, isolate failed components, and implement remediation strategies, while automated diagnostics streamline incident response times, ultimately delivering faster resolution and enhanced network reliability.
User interface design significantly impacts SDN controller dashboard usability by determining how effectively network administrators can monitor traffic, configure policies, troubleshoot issues, and manage resources through intuitive visualizations and controls. Well-designed interfaces streamline complex network operations, reduce training time, and minimize configuration errors, with many enterprises finding that clear dashboards enhance operational efficiency and enable faster response to network incidents.
Automation can be integrated through policy-based traffic management, self-healing network protocols, automated load balancing, real-time threat response systems, and intelligent resource allocation algorithms. These automated features streamline network operations by reducing manual interventions, accelerating incident resolution, and optimizing bandwidth distribution, with many enterprises finding that automated SDN dashboards deliver significantly improved operational efficiency and reduced network downtime.
SDN controller dashboards can be customized through role-based access controls, personalized widgets, tailored metrics displays, and hierarchical permission structures that align with specific job functions. Network administrators might focus on performance analytics and security alerts, while executives prefer high-level KPIs and cost optimization views, ultimately enabling teams to streamline operations and enhance decision-making efficiency.
Best practices for SDN controller dashboard data visualization include using real-time network topology maps, hierarchical views for multi-layer visibility, color-coded status indicators, interactive drill-down capabilities, and customizable widgets for specific metrics. These visualization techniques streamline network monitoring by enabling rapid issue identification, predictive analytics integration, and intuitive policy management interfaces, ultimately delivering enhanced operational efficiency and faster network troubleshooting for enterprise IT teams.
The choice of SDN controller significantly influences dashboard design through architecture compatibility, API integration capabilities, and feature set alignment. Controllers like OpenDaylight or ONOS require different visualization approaches for network topology, flow management, and policy configuration, with many enterprises finding that controller-specific dashboards deliver enhanced operational efficiency, streamlined troubleshooting, and better network visibility than generic alternatives.
SDN controller dashboards should incorporate network performance alerts, security breach notifications, bandwidth threshold warnings, device failure alerts, and traffic anomaly detections. These automated notifications enable network administrators to respond quickly to critical issues like DDoS attacks or equipment failures, ultimately maintaining optimal network performance and minimizing costly downtime across enterprise infrastructures.
Historical data in SDN controller dashboards enables predictive analytics, trend identification, capacity planning, and performance optimization through machine learning algorithms and statistical analysis. Banks and telecom providers leverage this data to anticipate network congestion, optimize resource allocation, and prevent service disruptions, ultimately delivering proactive network management and enhanced operational efficiency.
SDN dashboard security considerations include multi-factor authentication, role-based access controls, encrypted data transmission, network segmentation, and real-time threat monitoring capabilities. These security measures streamline network protection by preventing unauthorized access, isolating critical infrastructure components, and enabling rapid incident response, with many financial services and healthcare organizations finding that comprehensive dashboard security ultimately delivers enhanced operational resilience and regulatory compliance.
Open-source SDN controller dashboards offer cost-effectiveness, customization flexibility, and community-driven development, while proprietary solutions provide dedicated support, advanced security features, and integrated vendor ecosystems. Many enterprises find that open-source options like OpenDaylight or ONOS deliver robust network management capabilities with faster innovation cycles, though proprietary solutions often ensure streamlined deployment and comprehensive warranty coverage, ultimately enabling organizations to choose based on their specific operational requirements and strategic priorities.
SDN controller dashboards typically leverage web-based technologies including React, Angular, or Vue.js for frontend interfaces, REST APIs for controller communication, and real-time frameworks like WebSocket or Node.js for live network monitoring. These technologies streamline network visualization, automate policy management, and enhance operational efficiency, with many telecommunications and enterprise organizations finding that integrated dashboards deliver faster troubleshooting and improved network transparency.
Integration with other network management tools through SDN dashboards is achieved through APIs, standardized protocols like NETCONF and RESTCONF, and middleware platforms that enable seamless data exchange. These integration capabilities allow network administrators to consolidate monitoring across hybrid infrastructures, automate policy enforcement, and correlate performance metrics from multiple systems, ultimately delivering unified visibility and streamlined operations for increasingly complex network environments.
-
Delighted to see unique and eye-catching PowerPoint designs that are so easy to customize.
-
Professional and unique presentations.