


SDN Overview Dashboard For Software Defined Networking SDN




Try Before you Buy Download Free Sample Product
 Impress Your
Audience
 100%
Editable
 Save Hours
of Time


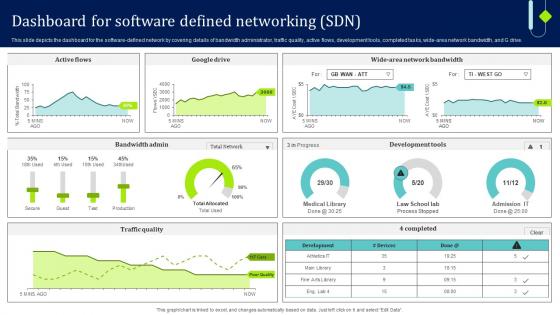
This slide depicts the dashboard for the software defined network by covering details of bandwidth administrator, traffic quality, active flows, development tools, completed tasks, wide area network bandwidth, and G drive.
People who downloaded this PowerPoint presentation also viewed the following :
SDN Overview Dashboard For Software Defined Networking SDN with all 7 slides:
Use our SDN Overview Dashboard For Software Defined Networking SDN to effectively help you save your valuable time. They are readymade to fit into any presentation structure.







FAQs for SDN Overview Dashboard For Software
SDN Overview Dashboard implementation delivers centralized network visibility, real-time monitoring capabilities, automated policy management, simplified troubleshooting processes, and enhanced resource optimization across distributed infrastructures. These dashboards streamline operations by providing comprehensive traffic analytics, proactive threat detection, and dynamic bandwidth allocation, with many enterprises finding that centralized control ultimately reduces operational costs while accelerating network performance optimization.
An SDN Overview Dashboard enhances network visibility by providing real-time monitoring, centralized traffic analysis, performance metrics tracking, and automated alerts for anomalies. Through comprehensive data visualization, network administrators can quickly identify bottlenecks, optimize resource allocation, and proactively address issues, with many enterprises finding that this centralized approach reduces troubleshooting time and ultimately delivers improved network reliability.
An SDN Overview Dashboard aids troubleshooting by providing real-time network visibility, centralized monitoring of traffic flows, automated fault detection, and comprehensive performance analytics across all network segments. Through unified dashboards, IT teams can quickly identify bottlenecks, isolate failed components, and implement rapid remediation strategies, ultimately reducing downtime from hours to minutes while enhancing overall network reliability.
**INPUT**: What metrics should be tracked in an SDN Overview Dashboard to ensure optimal performance? **OUTPUT**: Key SDN dashboard metrics include network latency, bandwidth utilization, controller performance, flow table efficiency, and security threat detection rates. These metrics enable network administrators to identify bottlenecks, optimize resource allocation, and maintain service quality across enterprise infrastructure, with many organizations finding that real-time monitoring ultimately delivers faster troubleshooting and enhanced operational efficiency.
Real-time analytics in an SDN Overview Dashboard enhance network decision-making by providing instant visibility into traffic patterns, performance metrics, and potential bottlenecks across the entire infrastructure. Through continuous monitoring and predictive insights, network administrators can proactively optimize bandwidth allocation, prevent outages, and streamline resource distribution, ultimately delivering faster response times and improved operational efficiency.
Automation streamlines SDN Overview Dashboard operations by enabling real-time network monitoring, automatic policy enforcement, dynamic traffic routing, and proactive issue resolution. Through intelligent algorithms, network administrators can minimize manual interventions, accelerate response times, and optimize resource allocation, while ensuring consistent performance across complex infrastructures, ultimately delivering enhanced operational efficiency and reduced management overhead.
An SDN Overview Dashboard facilitates cloud integration by providing centralized visibility into network policies, traffic flows, and resource allocation across hybrid environments. Through real-time monitoring and automated provisioning controls, organizations can seamlessly manage multi-cloud deployments, optimize bandwidth allocation, and ensure consistent security policies, ultimately delivering faster service deployment and enhanced operational efficiency.
**INPUT**: What security features should be included in an SDN Overview Dashboard? **OUTPUT**: Essential SDN Overview Dashboard security features include threat detection analytics, network access controls, traffic monitoring systems, vulnerability assessments, and incident response tracking. These capabilities enhance network security by providing real-time visibility, automated threat identification, and comprehensive policy enforcement, with many organizations finding that integrated security dashboards streamline operations while delivering faster incident response. *[Word count: 54]*
The user interface design of an SDN Overview Dashboard significantly impacts user experience by determining information accessibility, navigation efficiency, and decision-making speed through intuitive layouts, clear data visualization, and streamlined controls. Well-designed interfaces enable network administrators to quickly identify issues, monitor performance metrics, and implement changes seamlessly, ultimately delivering faster problem resolution and enhanced operational efficiency across enterprise networks.
Common challenges include network complexity visualization, real-time data integration, scalability across diverse infrastructure, user interface design for technical and non-technical users, and performance optimization. These obstacles require strategic combination of advanced analytics, intuitive design principles, and robust architecture, with many organizations finding that addressing visualization and data integration first streamlines overall dashboard effectiveness and user adoption.
SDN Overview Dashboards can be customized through configurable widgets, role-based access controls, custom alerts, personalized reporting modules, and industry-specific templates. Organizations across sectors like telecommunications, healthcare, and financial services tailor these dashboards by adjusting network topology views, performance metrics, and monitoring parameters, ultimately delivering enhanced operational visibility and streamlined network management efficiency.
SDN Overview Dashboards support regulatory compliance by providing centralized monitoring, automated reporting capabilities, real-time network visibility, and comprehensive audit trails that document all network changes and access patterns. These dashboards enable organizations in financial services, healthcare, and telecommunications to streamline compliance processes, reduce manual oversight burdens, and maintain consistent regulatory standards, ultimately delivering faster audit responses and enhanced operational transparency.
Effective SDN dashboard visualizations include network topology maps, real-time traffic flow diagrams, bandwidth utilization charts, latency heat maps, and device status indicators. These visualizations enable network administrators to quickly identify bottlenecks, monitor performance across distributed infrastructure, and streamline troubleshooting processes, with many organizations finding that comprehensive visual representations ultimately enhance operational efficiency and reduce network downtime.
Machine learning integration enables SDN Overview Dashboards to deliver predictive analytics through automated pattern recognition, anomaly detection, traffic forecasting, and performance optimization algorithms. These intelligent systems analyze historical network data, identify emerging bottlenecks before they impact operations, and automatically adjust routing policies, with many organizations finding that ML-enhanced dashboards reduce network downtime while streamlining operational efficiency.
Best practices for implementing an SDN Overview Dashboard include establishing clear monitoring objectives, integrating comprehensive network visibility tools, defining relevant KPIs and thresholds, and ensuring seamless integration with existing infrastructure management systems. Organizations should prioritize real-time data accuracy, user-friendly interface design, and role-based access controls, while implementing automated alerting mechanisms and regular performance reviews, ultimately delivering enhanced network transparency and faster incident response capabilities.
-
Impressive templates. Designing a presentation is fun now!
-
Huge collection of high-quality templates. Worth each penny.