

Sell through analysis dashboard ppt presentation powerpoint





Try Before you Buy Download Free Sample Product
 Impress Your
Audience
 100%
Editable
 Save Hours
of Time


Control the board with our Sell Through Analysis Dashboard Ppt Presentation Powerpoint. They ensure an excellent opening gambit.
People who downloaded this PowerPoint presentation also viewed the following :
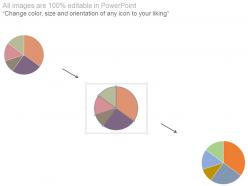
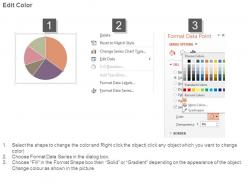
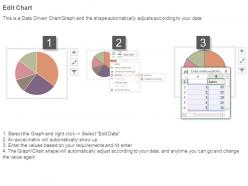
Sell through analysis dashboard ppt presentation powerpoint with all 4 slides:
Denials disappear with our Sell Through Analysis Dashboard Ppt Presentation Powerpoint. They always beget approvals.

FAQs for Sell through analysis dashboard
Key sell-through metrics include inventory turnover rates, days sales outstanding, conversion rates, average selling prices, and channel performance ratios. These measurements enable retailers and manufacturers to optimize stock levels, identify high-performing products, and streamline distribution strategies, with many organizations finding that comprehensive tracking ultimately delivers improved cash flow and competitive market positioning.
Sell-through rates influence inventory management strategies by providing data-driven insights for stock level optimization, reorder timing, and demand forecasting accuracy. High sell-through rates indicate strong demand requiring increased inventory levels, while low rates signal overstocking issues, with many retailers finding that regular analysis enables better cash flow management and reduces carrying costs.
Common pitfalls include relying on incomplete data, ignoring seasonal variations, failing to segment by product categories, overlooking competitor impacts, and misaligning inventory levels with demand patterns. These analytical oversights can lead to stockouts, excess inventory, and missed revenue opportunities, with many retailers finding that comprehensive data integration and regular analysis updates ultimately deliver more accurate demand forecasting and improved profitability.
Sell-through analysis differs significantly across channels, with online platforms providing real-time data tracking, detailed customer behavior insights, and automated inventory updates, while brick-and-mortar stores rely more on periodic inventory counts, POS system data, and manual analysis. These channel-specific approaches enable retailers to optimize inventory allocation, enhance customer experiences, and streamline operations, with many finding that integrated omnichannel analysis ultimately delivers comprehensive market visibility and competitive advantage.
Seasonal demand significantly impacts sell-through analysis by creating predictable fluctuations that require adjusted forecasting models, inventory planning strategies, and performance benchmarks throughout different periods. Retailers in fashion, electronics, and consumer goods leverage seasonal patterns to optimize stock levels, promotional timing, and product mix decisions, ultimately enhancing inventory turnover and minimizing markdowns while maximizing revenue during peak seasons.
Sell-through analysis identifies underperforming products by comparing actual sales velocity against targets, inventory levels, and category benchmarks, revealing items with slow turnover rates, declining trends, or poor conversion ratios. Through detailed performance metrics, retailers can pinpoint specific products requiring strategic intervention, promotional support, or discontinuation, ultimately optimizing inventory allocation and maximizing profitability across their portfolio.
**INPUT**: What tools and software are most effective for conducting sell-through analysis? **OUTPUT**: Effective sell-through analysis tools include retail analytics platforms like Nielsen, IRI, and Tableau, inventory management systems, ERP software, and specialized retail intelligence solutions. These technologies streamline data collection, automate reporting processes, and deliver real-time insights across multiple sales channels, with many retailers finding that integrated dashboards ultimately enhance inventory optimization and strategic decision-making capabilities. [Word count: 58 words]
Sell-through rates directly influence pricing strategies by revealing demand elasticity, optimal price points, inventory turnover patterns, and customer price sensitivity across different product categories. Low sell-through rates often prompt strategic discount offerings, clearance pricing, and promotional campaigns, while high rates enable premium pricing and reduced promotional dependency, ultimately helping retailers optimize profit margins and competitive positioning.
Higher sell-through rates often correlate with increased customer satisfaction, as popular products indicate strong market demand, effective pricing strategies, and successful product positioning. This correlation strengthens when retailers analyze customer feedback alongside sales velocity, with many retail organizations finding that products achieving 80%+ sell-through rates typically receive higher satisfaction scores and generate repeat purchases.
Sell-through analysis aids forecasting by examining actual consumer purchase patterns, seasonal fluctuations, inventory turnover rates, and demand cycles across different channels and timeframes. By analyzing these historical consumption trends, retailers can predict future demand more accurately, optimize inventory levels, and adjust procurement strategies, ultimately enabling better resource allocation and reducing stockouts while minimizing excess inventory costs.
Sell-through rates directly measure promotional success by revealing how quickly inventory moves during campaigns, enabling retailers to assess campaign ROI, customer response, and demand generation effectiveness. These metrics help optimize future promotional strategies by identifying which offers, channels, and timing deliver the strongest conversion rates, ultimately enabling businesses to allocate marketing budgets more strategically and maximize revenue impact.
Consumer behavior changes significantly impact sell-through analysis by altering demand patterns, purchase timing, and channel preferences, requiring businesses to continuously recalibrate their forecasting models and inventory strategies. These evolving behaviors, from increased online shopping to seasonal preference shifts, enable retailers and manufacturers to identify emerging trends, optimize stock levels, and enhance product positioning, ultimately delivering improved inventory turnover and customer satisfaction.
Best practices for reporting sell-through analysis findings include creating executive summaries with key metrics, using visual dashboards for trend identification, segmenting data by product categories and regions, and providing actionable recommendations with clear timelines. These reporting methods enhance stakeholder understanding by presenting complex inventory data through accessible formats, while enabling faster decision-making on product positioning, promotional strategies, and supply chain adjustments, ultimately delivering improved inventory turnover and stronger retail partnerships.
Sell-through analysis enhances supplier relationships by providing transparent, data-driven insights into actual product performance, demand patterns, and inventory turnover rates. This shared visibility enables more collaborative forecasting, strategic pricing negotiations, and joint promotional planning, with many retailers and suppliers finding that these partnerships ultimately deliver improved inventory optimization, reduced stockouts, and stronger competitive positioning in the marketplace.
Based on sell-through analysis insights, businesses can adjust inventory levels, optimize pricing strategies, reallocate resources to high-performing products, and modify marketing campaigns to boost slower-moving items. These strategic adjustments enable retailers to minimize stockouts, reduce excess inventory costs, and enhance customer satisfaction, with many organizations finding that data-driven inventory decisions ultimately deliver improved profit margins and competitive advantage.
-
Illustrative design with editable content. Exceptional value for money. Highly pleased with the product.
-
Easy to edit slides with easy to understand instructions.