


Sipoc diagram suppliers inputs process output customers powerpoint guide




Try Before you Buy Download Free Sample Product
 Impress Your
 Audience
 100%
100% Editable
 Save Hours
 of Time


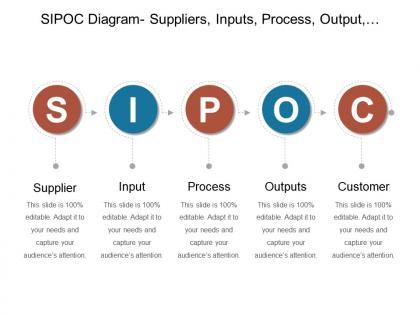
Thinking of creating a visual tool for documenting your business processes from beginning to end. Use our sipoc diagram suppliers inputs process output customers PowerPoint guide template and impress your viewers. Sipoc is an acronym that stands for supplies, inputs, process, outputs and customers. It identifies the inputs necessary for process to operate, who supplies them; and the outputs of the process, and who consumes them. This latter stage is crucial as it identifies who says the outputs are satisfactory. This sipoc model presentation slideshow displays the inputs and outputs at every step of the process, and records measurements about them. You can simply add your own content directly with a variety of customization choices as our design slide is completely editable. This sipoc diagram PPT design has been specifically designed by our experts to provide a never seen and felt before presentation experience. We also have designs available that can be perfect for the presentation. Our Sipoc Diagram Suppliers Inputs Process Output Customers Powerpoint Guide give you a free hand. They allow for any experimentation.
People who downloaded this PowerPoint presentation also viewed the following :
Sipoc diagram suppliers inputs process output customers powerpoint guide with all 5 slides:
Begin with the advantage with our Sipoc Diagram Suppliers Inputs Process Output Customers Powerpoint Guide. Your ideas will get off the ground.


FAQs for Sipoc diagram suppliers inputs process output
A SIPOC diagram clarifies process boundaries by identifying Suppliers, Inputs, Process steps, Outputs, and Customers, enabling teams to understand scope and stakeholder relationships before improvement initiatives begin. This structured approach streamlines problem identification, enhances cross-functional communication, and reduces project scope creep, with many organizations finding that early SIPOC mapping accelerates improvement timelines and delivers more targeted solutions.
A SIPOC diagram aids in understanding customer requirements by clearly mapping suppliers, inputs, processes, outputs, and customers in a single visual framework, helping teams identify what customers actually need versus what they assume. Through systematic analysis of the customer segment, organizations can align their processes with specific requirements, enhance service delivery, and reduce gaps between expectations and outcomes, ultimately delivering more targeted solutions and improved customer satisfaction.
SIPOC diagrams include Suppliers (input providers), Inputs (resources and materials), Process (transformation activities), Outputs (deliverables and results), and Customers (recipients of outputs). These components interact sequentially, with suppliers feeding inputs into processes that transform them into outputs for customers, enabling organizations to visualize workflow dependencies, identify improvement opportunities, and streamline operations across departments.
SIPOC diagrams are most beneficial when analyzing complex processes with unclear boundaries, multiple stakeholders, or quality issues requiring systematic improvement. They prove especially valuable during process optimization projects, Six Sigma initiatives, and cross-functional team alignments, with many manufacturing, healthcare, and service organizations finding that SIPOC diagrams streamline communication and enhance operational efficiency.
SIPOC diagrams enhance cross-functional collaboration by clearly mapping suppliers, inputs, processes, outputs, and customers, creating shared understanding across departments and eliminating communication gaps. Through visual process documentation, teams align on responsibilities, identify interdependencies, and streamline handoffs between functions, with many organizations finding that this transparency reduces conflicts, accelerates project timelines, and ultimately delivers improved operational efficiency.
Common mistakes include defining scope too broadly or narrowly, listing generic suppliers instead of specific sources, focusing on detailed processes rather than high-level steps, and identifying irrelevant customers or requirements. These errors undermine process clarity and stakeholder alignment, with many organizations finding that overly complex diagrams fail to deliver the strategic visibility and operational efficiency that well-structured SIPOC frameworks provide.
Technology tools streamline SIPOC diagram development through collaborative platforms, automated data mapping, real-time editing capabilities, and integration with existing business systems. These digital solutions enable teams to create interactive diagrams, share insights across departments, and maintain version control, while cloud-based platforms facilitate remote collaboration, ultimately delivering faster process documentation and enhanced organizational alignment.
In SIPOC diagrams, suppliers provide the essential inputs that enable process execution, including raw materials, information, resources, and services required for operations. These external or internal entities directly impact process quality and efficiency, with manufacturing suppliers delivering components, information suppliers providing data, and service suppliers offering expertise, ultimately determining the process's ability to generate desired outputs and meet customer requirements.
SIPOC diagrams enhance project management by mapping suppliers, inputs, processes, outputs, and customers, providing comprehensive project visibility and stakeholder alignment from initiation through completion. Through this structured approach, project managers streamline resource allocation, identify potential bottlenecks early, and ensure deliverables meet customer requirements, ultimately delivering improved project outcomes and enhanced stakeholder satisfaction.
Effective SIPOC presentation practices include using clear visual hierarchy, consistent formatting, collaborative development sessions, stakeholder validation, and regular updates throughout process improvement initiatives. These approaches enhance understanding by ensuring all team members can easily follow process flows, while organizations in manufacturing, healthcare, and financial services find that well-presented SIPOC diagrams accelerate project alignment and deliver faster implementation outcomes.
SIPOC diagrams provide a high-level process overview focusing on suppliers, inputs, process steps, outputs, and customers, while flowcharts detail step-by-step workflows with decision points and pathways. While flowcharts excel in operational troubleshooting and detailed process analysis, SIPOC diagrams streamline strategic planning and stakeholder alignment, with many organizations finding this broader perspective enhances cross-functional collaboration and process optimization initiatives.
Yes, SIPOC diagrams effectively identify process inefficiencies by mapping suppliers, inputs, processes, outputs, and customers to reveal gaps, redundancies, and bottlenecks. This comprehensive view enables organizations to pinpoint unnecessary steps, resource waste, and communication breakdowns, with many manufacturing and service companies finding that SIPOC analysis streamlines operations while reducing costs and improving delivery timelines.
SIPOC diagrams integrate seamlessly with Lean Six Sigma, value stream mapping, process mapping, root cause analysis, and statistical process control methodologies. These strategic combinations enhance operational efficiency by identifying bottlenecks, reducing waste, and optimizing workflows, with many manufacturing and healthcare organizations finding that integrated approaches deliver faster problem resolution and measurable quality improvements.
SIPOC diagrams should be updated whenever significant process changes occur, including new suppliers, modified inputs, revised procedures, additional outputs, or changing customer requirements. Organizations typically review them quarterly or during continuous improvement initiatives, with many finding that regular updates during process optimization projects, system implementations, or regulatory changes ensure accuracy and maintain their strategic value for operational efficiency.
Manufacturing, healthcare, financial services, retail, and logistics commonly employ SIPOC diagrams for process improvement, quality management, and operational efficiency initiatives. These industries leverage SIPOC to streamline supply chains, enhance patient care workflows, optimize loan processing, and improve customer service delivery, ultimately delivering reduced costs and competitive advantage.
-
Great product with effective design. Helped a lot in our corporate presentations. Easy to edit and stunning visuals.
-
Great experience, I would definitely use your services further.