

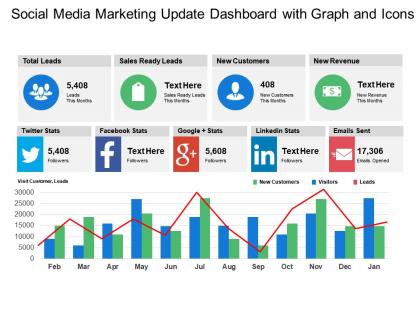
Social media marketing update dashboard with graph and icons




Try Before you Buy Download Free Sample Product
 Impress Your
 Audience
 100%
100% Editable
 Save Hours
 of Time


Forestall disappointment with our Social Media Marketing Update Dashboard With Graph And Icons. They help you overcome difficulties.
People who downloaded this PowerPoint presentation also viewed the following :
Social media marketing update dashboard with graph and icons with all 5 slides:
Get across to the best with our Social Media Marketing Update Dashboard With Graph And Icons. Force them to accept your brilliance.
FAQs for Social media marketing update dashboard with
A comprehensive social media marketing dashboard should include engagement rates, reach and impressions, follower growth, click-through rates, conversion tracking, and sentiment analysis. These metrics enable marketing teams to optimize content performance, measure ROI effectively, and adjust strategies in real-time, with many organizations finding that integrated dashboards streamline campaign management while delivering measurable business growth.
Visual data representation enhances social media marketing dashboards by transforming complex metrics into intuitive charts, graphs, and infographics that enable faster decision-making and pattern recognition. These visual elements streamline performance tracking across platforms like Instagram, Facebook, and LinkedIn, allowing marketing teams to quickly identify trending content, engagement spikes, and audience behaviors, ultimately delivering more strategic campaigns and improved ROI.
Essential tools include analytics platforms like Google Analytics and Facebook Insights, scheduling software such as Hootsuite or Buffer, content management systems, ROI tracking tools, and competitor analysis platforms. These technologies streamline campaign management by centralizing data collection, automating post scheduling, and measuring engagement metrics, with many marketing teams finding that integrated dashboards ultimately deliver faster decision-making and improved campaign performance.
Social media marketing dashboards should update data in real-time for engagement metrics and hourly for performance analytics, with comprehensive reporting refreshed daily or weekly depending on campaign intensity. This frequency enables marketers to capitalize on trending content immediately, adjust ad spend dynamically, and pivot strategies quickly, ultimately delivering more responsive campaigns and improved ROI across platforms.
Audience segmentation enables social media marketing dashboards to deliver targeted insights by categorizing followers based on demographics, behavior, interests, and engagement patterns. This strategic segmentation allows marketers to analyze campaign performance across specific groups, optimize content for different audience segments, and allocate resources more effectively, ultimately delivering higher engagement rates and improved ROI.
Businesses integrate real-time data through APIs connecting platforms like Facebook, Twitter, and Instagram, automated data feeds, social listening tools, and analytics software. These technologies streamline monitoring by consolidating engagement metrics, audience insights, and campaign performance instantly, enabling marketers to adjust strategies quickly, optimize content timing, and ultimately deliver more responsive customer experiences while maintaining competitive advantage.
Best practices for social media marketing dashboard color schemes include using high contrast ratios for readability, limiting palettes to 3-4 primary colors, employing consistent brand colors, and choosing neutral backgrounds with accent colors for key metrics. Effective layouts prioritize critical KPIs above the fold, group related metrics logically, and maintain consistent spacing, with many marketing teams finding that clean, intuitive designs significantly enhance data interpretation and decision-making speed.
A social media marketing dashboard helps track campaign performance by centralizing metrics like engagement rates, reach, conversions, click-through rates, and ROI across multiple platforms. Through real-time analytics and automated reporting, marketing teams can quickly identify high-performing content, optimize underperforming campaigns, and demonstrate clear business impact, ultimately enabling data-driven decisions that enhance customer acquisition and brand visibility.
Key engagement metrics include likes, comments, shares, saves, click-through rates, reach, impressions, and engagement rate percentages. These metrics work together by revealing audience interaction depth, content performance patterns, and campaign effectiveness, with many marketing teams finding that combining vanity metrics with actionable data delivers comprehensive insights for strategic optimization.
A/B testing results can be represented through comparative charts showing engagement rates, conversion metrics, click-through rates, audience reach differences, and performance timelines between variants. These visualizations enable marketers to quickly identify winning content strategies, optimize campaign elements, and make data-driven decisions, with many organizations finding that clear A/B testing displays significantly accelerate their social media optimization processes.
Sentiment analysis integrates into social media dashboards by monitoring brand mentions, tracking emotional responses to campaigns, and identifying emerging reputation issues in real-time. This enables marketers to gauge audience reactions, adjust messaging strategies, and respond proactively to negative feedback, ultimately delivering enhanced customer relationships and strategic competitive advantage.
Businesses can use social media marketing dashboards to benchmark against competitors by tracking engagement rates, follower growth, content performance, posting frequency, and audience demographics across platforms. Through competitive analysis features, companies can identify content gaps, optimize posting schedules, and refine messaging strategies, ultimately gaining insights that enhance their social media presence and deliver stronger customer engagement than rivals.
Common mistakes include overcrowding with excessive metrics, lacking clear objectives, ignoring audience-specific KPIs, poor visual hierarchy, and failing to align with business goals. These design flaws prevent effective decision-making, with many marketing teams finding that streamlined dashboards focusing on actionable insights, consistent branding, and relevant performance indicators ultimately deliver better strategic outcomes and improved campaign effectiveness.
Social media marketing dashboards facilitate collaboration by centralizing campaign data, enabling real-time performance tracking, and providing shared access to analytics across marketing, sales, and customer service teams. These platforms streamline communication through integrated commenting systems, automated reporting, and unified content calendars, with many organizations finding that cross-departmental visibility ultimately enhances campaign effectiveness and strategic alignment.
Tracking customer journeys through social media marketing dashboards reveals engagement patterns, conversion touchpoints, content preferences, drop-off stages, and cross-platform behavior analytics. These insights enable marketers to optimize content timing, personalize messaging strategies, and identify high-performing channels, with many organizations finding that journey mapping ultimately delivers improved conversion rates and enhanced customer acquisition costs.
-
Editable templates with innovative design and color combination.
-
Attractive design and informative presentation.