

Stock Market Prediction Through LSTM And XAI Finance Automation Through AI And Machine AI SS V





Try Before you Buy Download Free Sample Product
 Impress Your
Audience
 100%
Editable
 Save Hours
of Time


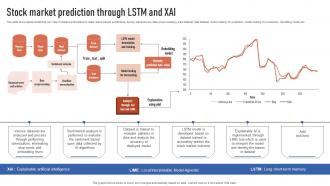
This slide showcases model that can help investors and traders to make stock market predictions. Its key elements are data preprocessing, train dataset, test dataset, model testing for prediction, model testing for prediction, rebuilding model etc.
People who downloaded this PowerPoint presentation also viewed the following :
Stock Market Prediction Through LSTM And XAI Finance Automation Through AI And Machine AI SS V with all 10 slides:
Use our Stock Market Prediction Through LSTM And XAI Finance Automation Through AI And Machine AI SS V to effectively help you save your valuable time. They are readymade to fit into any presentation structure.







FAQs for Stock Market Prediction Through LSTM And XAI Finance Automation Through AI And Machine
Honestly, I'd start with the basics - GDP growth, employment numbers, that stuff. Then dig into company fundamentals like earnings and revenue. Interest rates are probably the biggest driver though, they literally move everything. Technical stuff like moving averages and volume can help too. The VIX shows market fear levels, which is useful but man, analyst ratings are all over the place half the time. Don't put all your eggs in one basket with indicators. Pick 3-4 that match how you invest and your timeline. Mix economic data with technical signals - that combo works way better than going solo on any single metric.
Honestly, AI has changed the whole stock prediction game. These algorithms can crunch insane amounts of data - social media vibes, satellite images, even credit card spending patterns. Way beyond just looking at charts like we used to. Some old-school traders still love their technical indicators though, which I get. The crazy part is how fast these systems spot patterns that would take humans forever to notice. But here's the thing - they're not magic. You still gotta manage your risk properly. I learned that the hard way last year. Don't put all your faith in one model, no matter how fancy it looks.
So GDP and unemployment rates are like the economy's report card - they show where things might be heading, which moves stock prices. Strong GDP plus low unemployment usually means investors get excited and buy more stocks. Bad numbers? Everyone runs for the hills. But honestly, I wouldn't bet everything on these indicators alone since the market often reacts way before the actual data comes out. They're useful for context, but you'll want to look at other stuff too. Markets are weird like that - sometimes they completely ignore what should be obvious signals.
Look, patterns can give you decent short-term signals, but don't expect them to predict the future reliably. They work sometimes because everyone's watching the same charts - creates this weird self-fulfilling thing. Markets get hit by random news, economic chaos, people panicking... stuff that historical data can't see coming. My buddy lost his shirt thinking he'd cracked some pattern last year. Always mix technical stuff with fundamentals if you're gonna trade. Don't risk money you actually need. Patterns are just one piece of the puzzle, not some magic formula.
Dude, geopolitical chaos makes stock predictions nearly impossible because markets absolutely lose their minds when there's uncertainty. Wars, trade fights, political drama - all that stuff sends investors into panic mode and creates wild volatility. Your typical prediction models? They're basically useless during these times since they can't handle sudden shocks. It's honestly like trying to forecast weather in a tornado. I'd stick to shorter timeframes when things get crazy and always have backup scenarios ready. Never put all your eggs in one prediction basket during these periods.
Yeah, so technical analysis has some major blind spots. News events, earnings surprises, random announcements - none of that shows up on charts, but it'll totally wreck your patterns. Plus you're basically betting that old price movements predict new ones, which... doesn't always work out. Here's the thing though - everyone can see the same patterns you do. When too many people trade the same signals, they stop working. Honestly, I've seen this happen so many times. Use it as part of your strategy for sure, but don't rely on it alone. Mix in some fundamental research too.
Dude, sentiment analysis is actually pretty solid for stock picks. People's emotions move markets way more than they should - fear and greed are real drivers here. Social media buzz, news vibes, survey data... all that stuff gives you insight into whether folks are bullish or bearish. Combine it with your regular technical analysis and you'll spot momentum shifts earlier. Just don't get sucked into every random tweet or headline noise. I'd start small - track a couple sentiment indicators with your normal stuff and see how they match up with price action. Works better than you'd think.
Honestly, earnings reports are like the pulse check for any stock. Companies either prove they're making real money or show they're just bleeding cash. Stock prices usually pop when earnings crush expectations - investors love that stuff. But here's the thing: even decent earnings can tank a stock if Wall Street was expecting something amazing. Markets are weird like that, pricing everything in ahead of time. Don't just look at the raw numbers though. Management's forward guidance and their commentary during calls? That's where you'll find the good intel about what's actually coming next.
Yeah, HFT makes stock predictions way harder. These algorithms are firing off thousands of trades every second - it's honestly insane how fast they move. All that creates tons of noise and micro-movements that mess with traditional models. You'll need shorter timeframes and way more sophisticated analysis to handle it. I'd probably focus on longer-term trends where the HFT chaos smooths out, or maybe work in volume patterns that capture those high-frequency effects. The rapid price swings are just brutal for prediction accuracy.
So basically analysts scrape Twitter, Reddit, StockTwits - all that stuff - looking for bullish or bearish chatter about stocks. They track mentions, hashtags, emotional language, then throw it into their algorithms. GameStop was like the perfect example of this, right? Social sentiment can't be your only move though since people manipulate it constantly. Way too noisy on its own. But mix those sentiment scores with your usual technical indicators and volume data? Actually pretty solid. I'd say pick a few stocks you already follow and just watch how the social buzz lines up with price action. You'll start seeing patterns.
Focus on two main things: fundamental analysis (company financials, earnings, industry stuff) and technical analysis (charts, moving averages, volume). Most predictions are educated guesses at best, but these help improve your odds. Start with basic financial statements and P/E ratios, then slowly add technical indicators. Yahoo Finance is decent for screening stocks - or just use whatever research tools your broker has. I mean, honestly, don't bet everything on any single pick though. That's just asking for trouble.
Honestly, trying to pick individual stocks is a total crapshoot - even the pros screw it up all the time. You're way better off spreading your money across different sectors and company sizes instead of gambling on a few picks. One bad stock can totally wreck all your wins from the good ones, which sucks. The whole market tends to go up over time anyway, so you might as well ride that wave. I'd probably start with some basic index funds if you don't know where to begin. Way less stressful than obsessing over stock picks every day.
Hey! So there's some cool stuff happening with stock prediction tech. Machine learning can crunch crazy amounts of data super fast - like, way better than old-school methods. The natural language processing stuff is getting insanely good at reading news sentiment and social media trends in real-time. Quantum computing might totally change financial modeling eventually, but that's still years away probably. Oh, and companies are using weird data sources now - satellite images, credit card spending patterns, all sorts of random stuff. Honestly though, I'd focus on ML models mixed with sentiment analysis if you're looking to actually use this stuff.
Look, you've got three big headaches here: market manipulation accusations, giving yourself unfair advantages, and potentially screwing up the whole system. Your models might work too well - sounds crazy but regulators hate when algo trading causes flash crashes. Then there's the obvious "making rich people richer" problem since only big players can afford this stuff. Oh, and you'll constantly wonder if you're actually helping markets work better or just skimming money off the top. I literally lost sleep over this when I started! Just be upfront about your methods and think beyond your own profits.
Look, macro conditions totally mess with stock predictions in ways that'll surprise you. Low interest rates? Growth stocks kill it. Rates go up? Your value picks suddenly look genius. GDP changes, employment shifts, inflation moves - they're always flipping which sectors actually work. Honestly, it's exhausting trying to keep up sometimes. Historical patterns become useless pretty fast when the whole economic backdrop changes. You've gotta keep tweaking your models based on what's happening right now instead of just banking on old data. It's like... the rules of the game keep changing mid-play.
-
Innovative and attractive designs.
-
I am extremely pleased with these PPT slides that we used for our event. They were easy to modify and came out great in all aspects!