

Store Revenue Comparison Column Chart





Try Before you Buy Download Free Sample Product
 Impress Your
Audience
 100%
Editable
 Save Hours
of Time


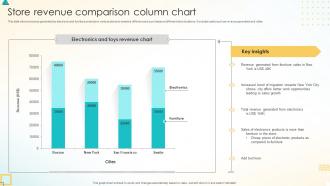
This slide shows revenue generated by electronic and furniture products in various stores to examine differences in purchases at different store locations. It includes parts such as revenue generated and cities.
This slide shows revenue generated by electronic and furniture products in various stores to examine differences in purchases at different store locations. It includes parts such as revenue generated and cities. Presenting our well-structured Store Revenue Comparison Column Chart. The topics discussed in this slide are Store Revenue Comparison, Column Chart. This is an instantly available PowerPoint presentation that can be edited conveniently. Download it right away and captivate your audience.
People who downloaded this PowerPoint presentation also viewed the following :
Store Revenue Comparison Column Chart with all 7 slides:
Use our Store Revenue Comparison Column Chart to effectively help you save your valuable time. They are readymade to fit into any presentation structure.






Most Relevant Reviews
-
I faced no difficulty while searching for the slide I wanted. Honestly, the website’s interface is easy to use and can be navigated easily!
-
These stunning templates can help you create a presentation like a pro.