

Strategic Group Map Analysis Of Retail Jewelry Industry




Try Before you Buy Download Free Sample Product
 Impress Your
 Audience
 100%
100% Editable
 Save Hours
 of Time


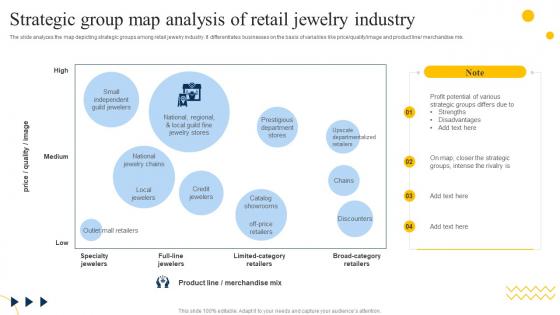
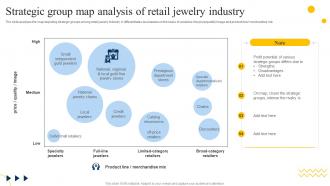
The slide analyzes the map depicting strategic groups among retail jewelry industry. It differentiates businesses on the basis of variables like price quality image and product line merchandise mix.
People who downloaded this PowerPoint presentation also viewed the following :
Strategic Group Map Analysis Of Retail Jewelry Industry with all 6 slides:
Use our Strategic Group Map Analysis Of Retail Jewelry Industry to effectively help you save your valuable time. They are readymade to fit into any presentation structure.





FAQs for Strategic Group Map Analysis Of
A strategic group map is a visual analytical tool that plots competitors within an industry based on two key strategic dimensions, such as price positioning and market scope, creating distinct competitive clusters. Through this mapping, businesses identify direct competitors, uncover market gaps, and assess competitive positioning across sectors like retail or financial services, ultimately enabling strategic repositioning decisions and revealing untapped market opportunities for sustainable competitive advantage.
Strategic group mapping reveals market gaps by visualizing competitor clusters based on key strategic dimensions like price points, service levels, and target segments. This analysis highlights underserved market spaces where few or no competitors operate, enabling companies to identify profitable positioning opportunities, unmet customer needs, and potential niches for expansion, ultimately delivering competitive advantage through strategic differentiation.
**INPUT**: What factors are typically used to create a strategic group map? **OUTPUT**: Strategic group maps typically use factors like price positioning, geographic scope, product range, distribution channels, service levels, and technology adoption as key dimensions. These strategic variables enable organizations to identify competitive clusters within industries, assess market positioning relative to rivals, and uncover potential opportunities for differentiation, with many companies finding that mapping reveals underserved segments and strategic gaps. **Word count: 58 words**
Strategic group mapping visualizes competitive advantage by plotting competitors across key dimensions like price, quality, distribution channels, and market scope, revealing performance gaps and market positioning opportunities. Through visual clustering, companies can identify underserved segments, benchmark against similar rivals, and spot strategic moves that differentiate them from competitors, ultimately enabling more targeted positioning decisions and sustainable competitive advantages.
A strategic group map differs from traditional market analysis by clustering competitors based on strategic dimensions like pricing and distribution, rather than analyzing the entire market broadly. This targeted approach enables organizations to identify direct competitors, uncover market gaps, and develop more precise competitive strategies, with many companies finding that strategic grouping reveals opportunities invisible in comprehensive market overviews.
Industries with complex competitive landscapes benefit most from strategic group mapping, including automotive, pharmaceuticals, technology, retail, and financial services. These sectors feature diverse strategic approaches, multiple market segments, and varying competitive dimensions, with many organizations finding that mapping reveals untapped market opportunities, identifies direct competitors, and enables strategic repositioning for competitive advantage.
Companies use strategic group maps to identify market positioning gaps, analyze competitor pricing strategies, and discover underserved customer segments through visual competitive analysis. By mapping competitors across key dimensions like price points and service levels, organizations can strategically differentiate their marketing messages, target specific niches, and position themselves advantageously within less crowded market spaces, ultimately delivering more focused campaigns and competitive advantage.
Consumer behavior directly influences strategic group positioning by determining which value propositions, pricing strategies, service levels, and distribution channels resonate with target segments. Companies align their strategic choices with consumer preferences, purchasing patterns, and decision-making processes, with retail, hospitality, and financial services finding that understanding demographic shifts, digital adoption rates, and price sensitivity ultimately drives competitive positioning and market differentiation strategies.
Strategic group mapping aids in identifying threats and opportunities by revealing competitive gaps, underserved market segments, and mobility barriers between groups. Through visual analysis of competitor positioning, companies can spot emerging threats from adjacent groups, discover unoccupied strategic spaces for expansion, and identify acquisition targets or partnership opportunities, ultimately enabling more informed strategic positioning decisions.
Strategic group maps present limitations including oversimplification of complex competitive dynamics, static snapshots that may miss rapid market shifts, subjective axis selection, and potential overlooking of emerging competitors or cross-industry threats. While these analytical tools streamline competitive analysis for organizations across sectors like retail and financial services, analysts must supplement them with dynamic market intelligence and broader environmental scanning to ensure comprehensive strategic insights.
Businesses should update their strategic group maps every 12-18 months, or immediately following significant market disruptions, competitive moves, or strategic pivots within their industry. This regular refresh enables companies to identify emerging competitors, shifting market positions, and new opportunities for differentiation, ultimately maintaining strategic clarity and competitive advantage in increasingly dynamic business environments.
Strategic group mapping integrates seamlessly with Porter's Five Forces analysis, SWOT frameworks, competitive intelligence platforms, and market segmentation tools to create comprehensive strategic insights. Through combining these analytical approaches, organizations enhance their competitive positioning, identify market opportunities more effectively, and develop robust strategic responses, with many consulting firms finding that integrated analytical frameworks deliver significantly stronger strategic recommendations and outcomes.
Analyzing mobility barriers between strategic groups reveals competitive dynamics, entry challenges, and strategic positioning opportunities that shape industry profitability and market access. These barriers, including capital requirements, regulatory constraints, and brand loyalty, help organizations identify potential expansion paths, assess competitive threats, and develop strategic moves that leverage their unique capabilities while minimizing resource requirements for market repositioning.
Technology influences strategic group mapping by reshaping competitive dimensions like digital capabilities, automation levels, data analytics sophistication, and platform integration strategies. These technological shifts create new mobility barriers between groups, with companies leveraging AI, cloud computing, and digital transformation initiatives to migrate across strategic positions, ultimately redefining industry boundaries and competitive landscapes.
Successful strategic group maps include Porter's pharmaceutical industry analysis mapping R&D investment versus market scope, the airline industry mapped by service level versus geographic coverage, and the automotive sector plotted by price range versus product differentiation. These maps have enabled companies in retail, banking, and technology to identify market gaps, reposition strategically, and discover untapped opportunities, ultimately delivering competitive advantage and clearer strategic direction.
-
Spacious slides, just right to include text. SlideTeam has also helped us focus on the most important points that need to be highlighted for our clients.
-
World-class PowerPoint designs that are fully customizable!