


Supply Chain Inventory And Logistics Powerpoint Presentation Slides





Try Before you Buy Download Free Sample Product
 Impress Your
 Audience
 100%
100% Editable
 Save Hours
 of Time


Download our supply chain inventory and logistics PowerPoint presentation slides for effective stock management. Managing the flow of goods from manufacturers to warehouses and from these facilities to point of sale is an important task. This content ready complete deck consists of a total of 79 slides. All the slides are designed very professionally and can be edited as per your requirement. All the diagrams, icons, colors and fonts are completely editable. This business operations PPT template includes various business-related slides such as introduction, background, operation management operation goals, process timeline, competitive strategies, operation strategy, productivity table, forecasting, process planning, design of work system, quality management system for improving, quality management control, quality control dashboard, quality cost report, supply chain management process, supply chain management bifurcation etc. Develop an effective methodology to keep track of logistics using this inventory management process PowerPoint presentations. Grab this amazing deck now. Include a good joke with our Supply Chain Inventory And Logistics Powerpoint Presentation Slides. Get folks feeling favorably inclined.
People who downloaded this PowerPoint presentation also viewed the following :
Content of this Powerpoint Presentation
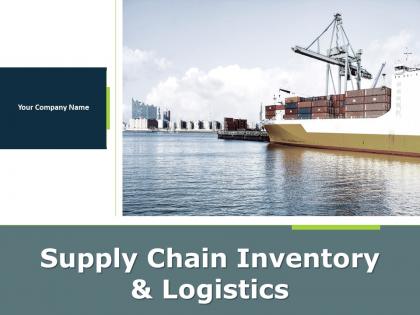
Slide 1: This slide introduces Supply Chain Inventory & Logistics. State Your Company Name and begin.
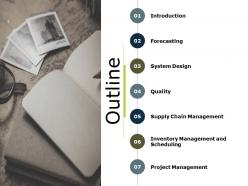
Slide 2: This slide shows Outline of the presentation.
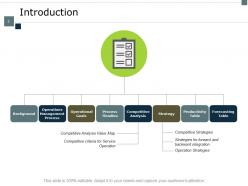
Slide 3: This slide presents Introduction describing- Forecasting Table, Productivity Table, Strategy, Competitive Analysis, Process Timeline, Operational Goals, Operations Management Process, Background.
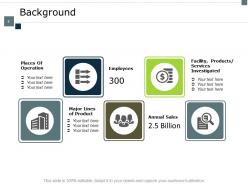
Slide 4: This slide displays Background describing- Places of Operation, Major Lines of Product, Employees, Facility, Products/Services Investigated, Annual Sales.
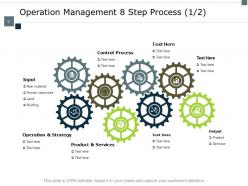
Slide 5: This slide represents Operation Management 8 Step Process. You can add data as per requirements.
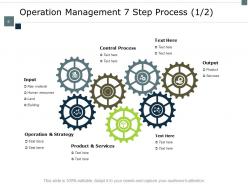
Slide 6: This slide showcases Operation Management 7 Step Process with icons and text boxes.
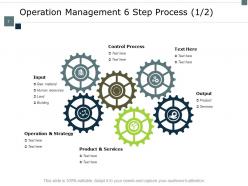
Slide 7: This slide shows Operation Management 6 Step Process. You can add or edit data as per requirements.
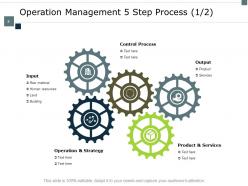
Slide 8: This slide presents Operation Management 5 Step Process.
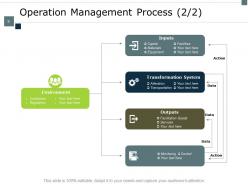
Slide 9: This slide displays Operation Management Process describing- Monitoring & Control, Inputs, Transformation System, Outputs, Environment.
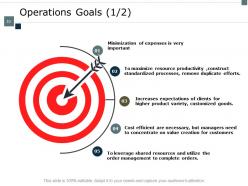
Slide 10: This slide represents Operations Goals with related imagery and text.
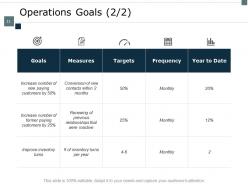
Slide 11: This is another slide for Operations Goals describing- Goals, measures, targets, frequency and year to date.
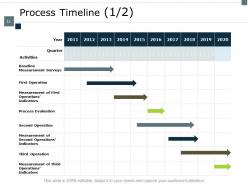
Slide 12: This slide showcases Process Timeline on yearly and quarterly basis. You can add or edit data as per needs.
Slide 13: This is another slide displaying Process Timeline on monthly basis.
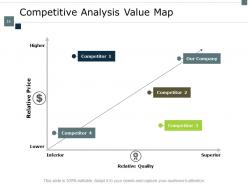
Slide 14: This slide shows Competitive Analysis Value Map comparing quality and price.
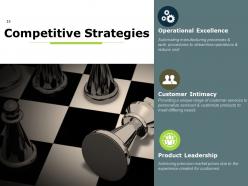
Slide 15: This slide presents Competitive Strategies describing- Operational Excellence, Customer Intimacy, Product Leadership.
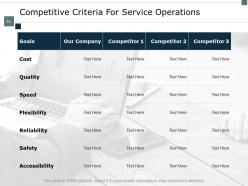
Slide 16: This slide displays Competitive Criteria For Service Operations.
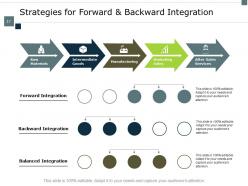
Slide 17: This slide represents Strategies for Forward & Backward Integration describing- Raw Materials, Intermediate Goods, Manufacturing, Marketing Sales, After Sales Services.
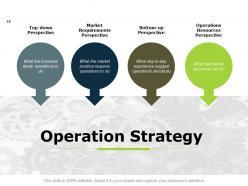
Slide 18: This slide showcases Operation Strategy with- Top-down Perspective, Market Requirements Perspective, Bottom-up Perspective, Operations Resources Perspective.
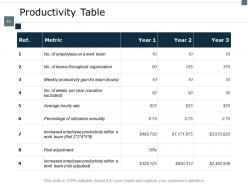
Slide 19: This slide shows Productivity Table. You can change the data as per requirements.
Slide 20: This slide presents Forecasting with related diagram and additional text boxes to show information.
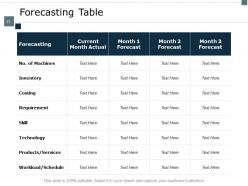
Slide 21: This slide displays Forecasting Table on monthly basis.
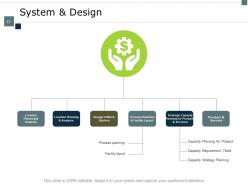
Slide 22: This slide represents System & Design describing- Product & Service Design, Strategic Capacity Planning for Products & Services, Process Selection & Facility Layout, Design of Work System, Location Planning & Analysis.
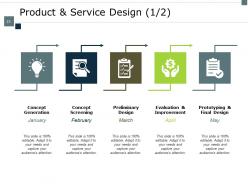
Slide 23: This slide showcases Product & Service Design describing- Concept Generation Concept Screening Evaluation & Improvement Prototyping & Final Design Preliminary Design
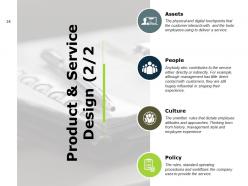
Slide 24: This is another slide for Product & Service Design describing- Assets, People, Culture and Policy.
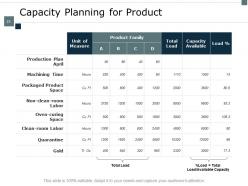
Slide 25: This slide shows Capacity Planning for Product.
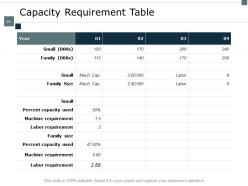
Slide 26: This slide presents Capacity Requirement Table. You can change the data as per needs.
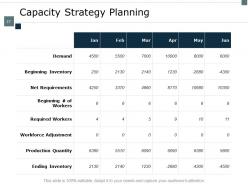
Slide 27: This slide displays Capacity Strategy Planning in tabular form.
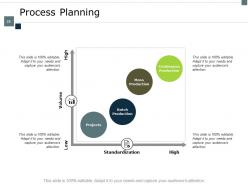
Slide 28: This slide represents Process Planning comparing standardization and volume.
Slide 29: This slide showcases Facility Layout describing- Milling, Assembly & Test, Drilling, Plating, Grinding.
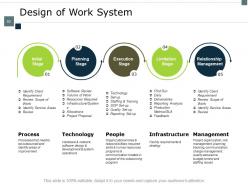
Slide 30: This slide shows Design of Work System describing- Process, Technology, People, Infrastructure, Management.
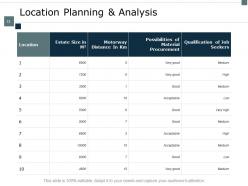
Slide 31: This slide presents Location Planning & Analysis in tabular form with categories as- Location, Estate size, Motorway distance, Possibilities of material procurement and Qualification of Job Seekers.
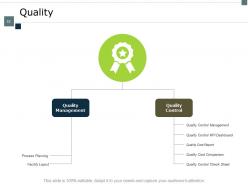
Slide 32: This slide is titled as Quality describing Quality management and Quality control.
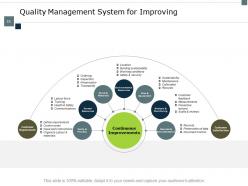
Slide 33: This slide displays Quality Management System for Improving describing- Verify & Process, Stock & Materials, Plan & Equipment, Records & Documentation, Human Resources, Environmental Resources, Analysis & Monitoring.
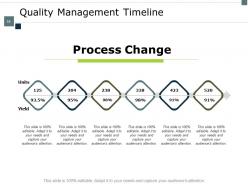
Slide 34: This slide represents Quality Management Timeline on monthly basis.
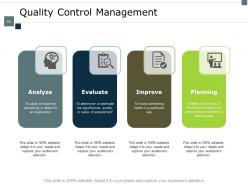
Slide 35: This slide showcases Quality Control Management Planning, Analyze, Evaluate, Improve.
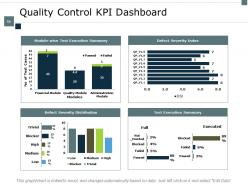
Slide 36: This slide presents Quality Control KPI Dashboard showing data in forms of graph.
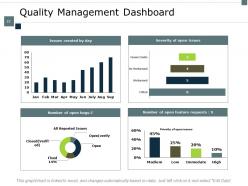
Slide 37: This slide shows Quality Management Dashboard with chart and bar graphs.
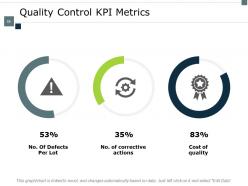
Slide 38: This slide displays Quality Control KPI Metrics describing- No. of defects per lot, No. of corrective actions, Cost of quality.
Slide 39: This slide represents Quality Cost Report in tabular form with categories as- Types of Cost, Quality Cost, Percentage of Sales.
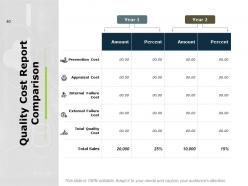
Slide 40: This slide showcases Quality Cost Report Comparison on yearly basis.
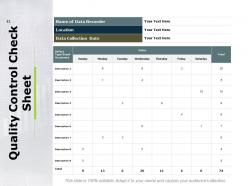
Slide 41: This slide shows Quality Control Check Sheet.
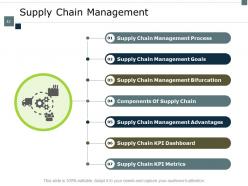
Slide 42: This slide presents Supply Chain Management describing- Supply Chain Management Process, Supply Chain KPI Dashboard, Supply Chain Management Bifurcation, Supply Chain Management Goals, Components of Supply Chain, Supply Chain Management Advantages, Supply Chain KPI Metrics.
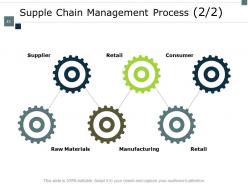
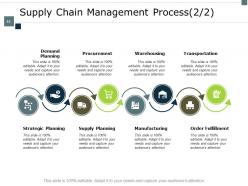
Slide 43: This slide displays Supply Chain Management Process describing- Raw Materials, Supplier, Manufacturing, Retail, Consumer.
Slide 44: This is another slide displaying Supply Chain Management Process.
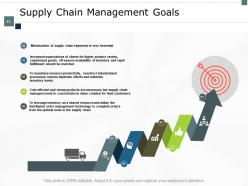
Slide 45: This slide represents Supply Chain Management Goals with related icons and text.
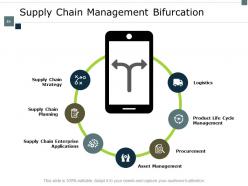
Slide 46: This slide showcases Supply Chain Management Bifurcation describing- Supply Chain Strategy, Supply Chain Planning, Supply Chain Enterprise Applications, Asset Management, Logistics, Product Life Cycle Management, Procurement.
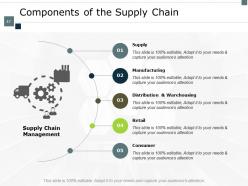
Slide 47: This slide shows Components of the Supply Chain describing- Supply, Manufacturing, Retail, Consumer, Distribution & Warehousing.
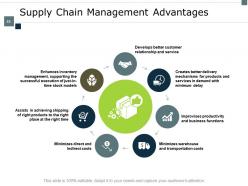
Slide 48: This slide presents Supply Chain Management Advantages.
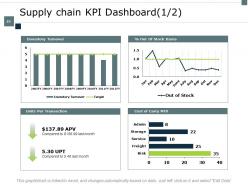
Slide 49: This slide displays Supply chain KPI Dashboard with the help of graphs.
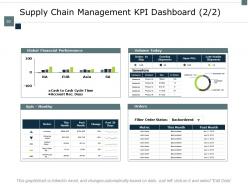
Slide 50: This is another slide displaying Supply Chain Management KPI Dashboard.
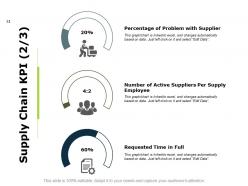
Slide 51: This slide represents Supply Chain KPI describing- Percentage of Problem With Supplier, Number of Active Suppliers Per Supply Employee, Requested Time In Full.
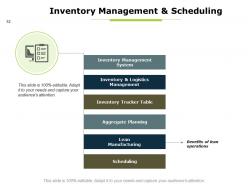
Slide 52: This slide displays Inventory Management & Scheduling describing- Inventory Management System, Scheduling, Inventory Tracker Table, Inventory & Logistics Management, Aggregate Planning, Lean Manufacturing.
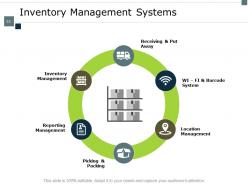
Slide 53: This slide represents Inventory Management Systems describing- Picking & Packing, Reporting Management, Receiving & Put Away, WI – FI & Barcode System, Location Management, Inventory Management.
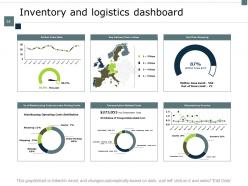
Slide 54: This slide showcases Inventory and logistics dashboard describing- One Time Shipping, Avg Delivery Time in Days, Warehousing Operating Costs distribution, Transportation Related Costs, Shipments by Country.
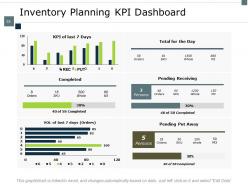
Slide 55: This slide shows Inventory Planning KPI Dashboard.
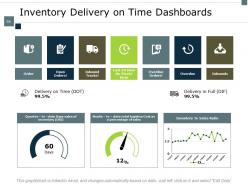
Slide 56: This slide presents Inventory Delivery on Time Dashboards.
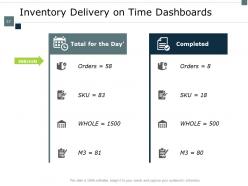
Slide 57: This is another slide for Inventory Delivery on Time Dashboards.
Slide 58: This slide represents Logistics KPI Metrics describing- Shipment by Country, Perfect order rate, Delivery Status.
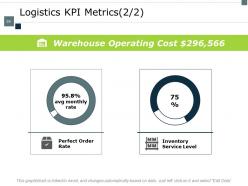
Slide 59: This is another slide representing Logistics KPI Metrics.
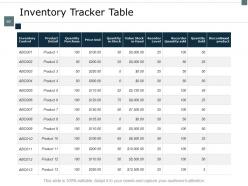
Slide 60: This slide showcases Inventory Tracker Table. You can add or edit data as per requirement.
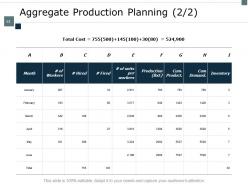
Slide 61: This slide shows Aggregate Production Planning in tabular form.
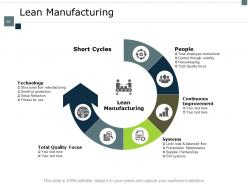
Slide 62: This slide presents Lean Manufacturing describing- People, Total Quality focus, Continuous Improvement, Systems, Technology, Short Cycles.
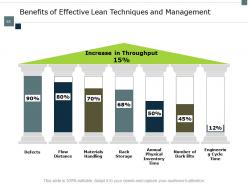
Slide 63: This slide displays Benefits of Effective Lean Techniques and Management.
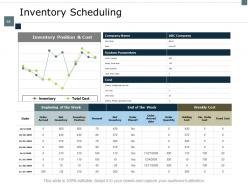
Slide 64: This slide represents Inventory Scheduling with help of tables and graph.
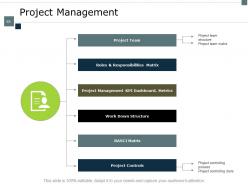
Slide 65: This slide showcases Project Management describing- Project Controls, RASCI Matrix, Work Down Structure, Project Management KPI Dashboard, Metrics, Roles & Responsibilities Matrix, Project Team.
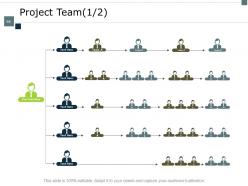
Slide 66: This slide shows Project Team in hierarchy form.
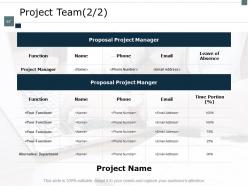
Slide 67: This is another slide presenting Project Team.
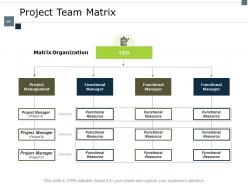
Slide 68: This slide presents Project Team Matrix with designation.
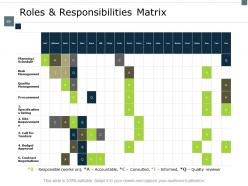
Slide 69: This slide displays Roles & Responsibilities Matrix.
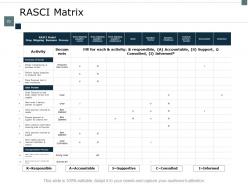
Slide 70: This slide represents RASCI Matrix describing person Responsible, Accountable, Consulted, Informed, Supportive.
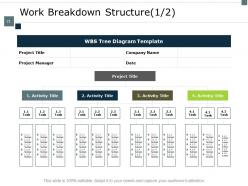
Slide 71: This slide showcases Work breakdown Structure in form of tree diagram.
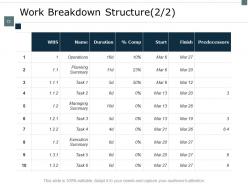
Slide 72: This is another slide showing Work breakdown Structure.
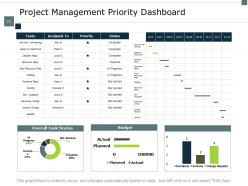
Slide 73: This slide shows Project Management Priority Dashboard with the help of tables and graphs.
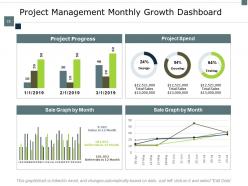
Slide 74: This slide presents Project Management Monthly Growth Dashboard.
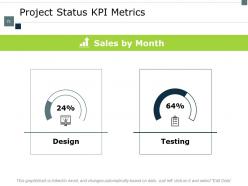
Slide 75: This slide displays Project Status KPI Metrics with sales on monthly basis.
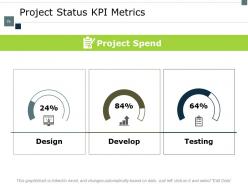
Slide 76: This slide represents Project Status KPI Metrics with project expenditure.
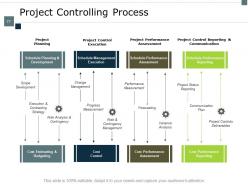
Slide 77: This slide showcases Project Controlling Process with related diagram.
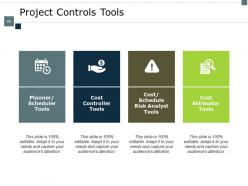
Slide 78: This slide shows Project Controls Tools describing- Planner/ Scheduler Tools, Cost Controller Tools, Cost/Schedule Risk Analyst Tools, Cost Estimator Tools.
Slide 79: This is a Thank You slide with address, contact numbers and email address.
Supply Chain Inventory And Logistics Powerpoint Presentation Slides with all 79 slides:
Use our Supply Chain Inventory And Logistics Powerpoint Presentation Slides to effectively help you save your valuable time. They are readymade to fit into any presentation structure.






FAQs for Supply Chain Inventory And Logistics
You need demand forecasting, solid supplier relationships, inventory optimization, and logistics coordination. Technology integration is huge - seriously, manual supply chain management is basically prehistoric at this point. Build strong partnerships with suppliers since they'll save your butt when stuff hits the fan. Risk management and backup plans are non-negotiable too. Map out your current processes first and find where things get stuck. Oh, and visibility across everything is key so you can catch issues early instead of scrambling later.
So here's the thing - IoT sensors let you track stuff in real-time, which is wild compared to how blind we used to be. Blockchain creates records nobody can mess with. Cloud platforms mean you can instantly share data with suppliers (assuming they don't hate new tech). AI spots problems before they blow up, which honestly saves so much headache. The tricky part? Make sure whatever tools you pick actually talk to each other. Otherwise you'll end up with a bunch of systems that don't connect and you're back where you started, just with fancier dashboards.
Look, sustainability isn't optional anymore in supply chains - customers care and regulations are tightening up fast. Most companies now track their carbon footprint and pick suppliers who don't trash the environment. Honestly though, it usually saves you money too through better efficiency, which is nice. You'll want to think about transport emissions, what you're packaging stuff in, and whether your suppliers are sketchy or not. My advice? Start by checking what your current suppliers are actually doing sustainability-wise. That's where you'll probably see the biggest impact right away.
Honestly, globalization is amazing for supply chains - cheaper materials, tons of supplier options, specialized factories everywhere. Trade policies mess everything up though. Tariffs hit and suddenly you're scrambling for new suppliers or paying way more. COVID was the perfect example of how quickly things fall apart when borders close overnight. I'd definitely spread your suppliers across different regions instead of putting all your eggs in one basket. Keep some local backup options too, even if they cost more. You never know when the next trade war's gonna start and you'll need those relationships.
Honestly, it's the same old headaches but way worse now. Suppliers are still flaky, lead times make zero sense, and don't even get me started on shipping costs - they're insane. Labor shortages hit everywhere too, warehouses to drivers. Demand patterns got weird permanently in some industries, so you need flexibility you didn't before. My advice? Build backup suppliers into your network and get decent visibility tools. Being able to spot problems before they smack you is so much better than scrambling after the fact.
Look, data analytics is basically pattern recognition on steroids - it'll catch stuff you'd never see manually. Predicting demand spikes, spotting bottlenecks early, optimizing inventory levels automatically. Works for everything from buying to shipping. Instead of making gut-feel decisions (which honestly bite you later), you're working with real trends and data. Supplier risk prediction is huge too. Start simple though - even basic sales numbers and inventory data can improve your planning right away. I mean, you're probably already collecting half this stuff anyway, so why not actually use it?
Start with an audit of what you've got right now - bet you'll find tons of dead inventory just sitting there. ABC analysis helps you focus on the stuff that actually matters instead of micromanaging every single item. Get your reorder points dialed in based on real lead times, not guesswork. Those giant yearly inventory counts are the worst, so do cycle counting throughout the year instead. JIT ordering works great when suppliers are reliable. Honestly, ditch the spreadsheets and get proper inventory software - learned that one the hard way. Safety stock should reflect actual demand variability, and forecasting gets easier once you have decent historical data.
Honestly, spread your suppliers around - putting everything with one company is basically gambling with your business. I'd start by figuring out which suppliers could really screw you over if they went under, then dig into their finances and track records. Set up good communication so problems don't blindside you. Always have backups ready, especially for the stuff you can't live without. Performance scorecards help too - delivery times, quality, how fast they respond to issues. The whole "partnership not vendor" thing actually matters here. Oh, and definitely map out your riskiest relationships first.
Honestly, diversifying your vendors is probably the biggest game-changer - don't put all your eggs in one basket. Cross-train your people so they can jump between roles when things go sideways. Real-time tracking tools are worth every penny, trust me. Data analytics help you catch issues early instead of scrambling later. Regional supply chains beat going purely global these days (learned that one the hard way). Oh, and always have backup plans ready. Multiple ones. The companies that can pivot fast with good data usually come out ahead.
So blockchain creates this tamper-proof record of every transaction and handoff - like a digital paper trail nobody can mess with. Makes it super hard for counterfeit stuff to sneak in. You'll get real-time tracking of where everything came from and who handled it. Honestly, it's a lifesaver for industries dealing with fraud issues. The catch? Implementation gets pricey and complicated, especially if your suppliers aren't great with tech (and let's be real, many aren't). I'd say start small - maybe pilot it on your riskiest products first.
Honestly, forecasting is like the backbone of your whole supply chain operation. Get it right and you'll nail your inventory levels, cut carrying costs, and never deal with those nightmare stockout situations that make customers hate you. But mess it up? You're either drowning in excess stock or frantically trying to fill orders you didn't see coming. Your suppliers need that demand visibility too - they can't plan production if they're flying blind. Worth investing in better forecasting tools though. Even tiny accuracy improvements make a huge difference in how smoothly everything runs.
Honestly, good communication is a game-changer for supply chains. Your suppliers can give you a heads up about delays before they wreck your timeline. Distributors might warn you about demand spikes coming your way. It's so much better than everyone working in their own bubble, you know? Real-time info flowing between partners means you'll catch problems early instead of scrambling later. Plus you can actually team up on backup plans when things go sideways. I'd start with regular check-ins with your main partners - maybe weekly calls or shared channels for urgent updates. Makes a huge difference.
So basically you're flipping the whole "make-take-toss" thing upside down. Now you're designing stuff to be reused and recycled right from the start. Your supplier relationships change completely, and you'll need systems to handle returns and waste - which honestly sounds like a headache but whatever. Tracking materials through multiple lifecycles becomes your new reality. Plus you're working way more closely with customers on getting products back. The cool part? What used to be trash might actually make you money now. I'd say just start by figuring out where this actually makes sense in what you're already doing.
So instead of guessing what customers want, just use actual data from your POS and online orders to drive everything. Way better than those forecasts that are always wrong anyway. Pull real sales signals and let them trigger your production decisions automatically. Your suppliers need shorter lead times though - that's the tricky part. Build some flexibility into operations so you can pivot fast when demand shifts. Oh and definitely test this on just one product line first because rolling it out everywhere at once would be chaos. The whole point is detecting patterns quickly and actually responding to them.
Honestly, start with the basics - delivery performance (on-time and in-full), inventory turnover, and cost per unit. Those cover your main bases. Supplier lead times matter too, plus quality stuff like defect rates because nobody wants customers blowing up your phone about broken products. Cash-to-cash cycle time is probably the most underrated metric - it shows how fast you're turning inventory back into actual money. I'd also throw in some industry-specific ones depending on what you're dealing with. But seriously, don't go crazy with like 20 different metrics. Pick maybe 5-7 max or you'll just end up buried in spreadsheets.
-
Very unique and reliable designs.
-
Illustrative design with editable content. Exceptional value for money. Highly pleased with the product.