Survey questionnaire analysis digital experience ppt powerpoint presentation mockup
This slide provides information regarding questionnaire analysis on various parameters.
This slide provides information regarding questionnaire analysis on various parameters.
- Google Slides is a new FREE Presentation software from Google.
- All our content is 100% compatible with Google Slides.
- Just download our designs, and upload them to Google Slides and they will work automatically.
- Amaze your audience with SlideTeam and Google Slides.
-
Want Changes to This PPT Slide? Check out our Presentation Design Services
- WideScreen Aspect ratio is becoming a very popular format. When you download this product, the downloaded ZIP will contain this product in both standard and widescreen format.
-

- Some older products that we have may only be in standard format, but they can easily be converted to widescreen.
- To do this, please open the SlideTeam product in Powerpoint, and go to
- Design ( On the top bar) -> Page Setup -> and select "On-screen Show (16:9)” in the drop down for "Slides Sized for".
- The slide or theme will change to widescreen, and all graphics will adjust automatically. You can similarly convert our content to any other desired screen aspect ratio.
Compatible With Google Slides

Get This In WideScreen
You must be logged in to download this presentation.
PowerPoint presentation slides
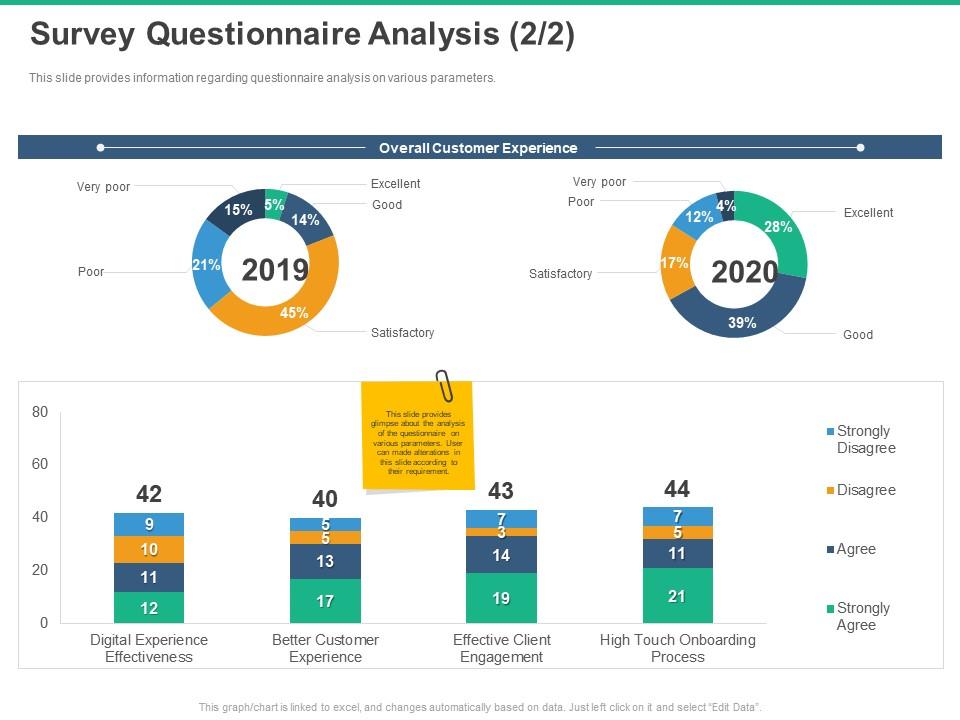
This slide provides information regarding questionnaire analysis on various parameters. Presenting this set of slides with name Survey Questionnaire Analysis Digital Experience Ppt Powerpoint Presentation Mockup. The topics discussed in these slides are Digital Experience Effectiveness, Better Customer Experience, Effective Client Engagement, Onboarding Process. This is a completely editable PowerPoint presentation and is available for immediate download. Download now and impress your audience.
People who downloaded this PowerPoint presentation also viewed the following :
Content of this Powerpoint Presentation
Description:
The image is a PowerPoint slide titled "Survey Questionnaire Analysis (2/2)" which appears to be the second part of a presentation analyzing survey results. It includes two pie charts and a bar graph.
The pie charts compare overall customer experience for two different years, 2019 and 2020, with segments labeled 'Very poor,' 'Poor,' 'Satisfactory,' 'Good,' and 'Excellent.' The 2019 chart shows the majority of responses were 'Satisfactory' at 45%, while in 2020, the majority of responses improved to 'Good' at 39%.
Below the pie charts is a bar graph with four categories: 'Digital Experience Effectiveness,' 'Better Customer Experience,' 'Effective Client Engagement,' and 'High Touch Onboarding Process.' Each bar is divided into segments representing different levels of agreement, from 'Strongly Disagree' to 'Strongly Agree.' The graph indicates that the highest level of agreement is with the 'High Touch Onboarding Process.'
A text box in the upper right corner of the bar graph states, "This slide provides a glimpse into the analysis of the questionnaire. User can make alterations in this slide according to their requirement."
Use Cases:
This slide can be utilized in various industries for assessing and presenting customer feedback:
1. Retail:
Use: Evaluating customer satisfaction with shopping experience.
Presenter: Customer Relations Manager
Audience: Retail staff, management team
2. Finance:
Use: Assessing client interactions with digital banking platforms.
Presenter: Digital Banking Strategist
Audience: Bank executives, customer service teams
3. Healthcare:
Use: Analyzing patient experiences with healthcare services.
Presenter: Quality Assurance Coordinator
Audience: Hospital administrators, medical staff
4. Technology:
Use: Understanding user feedback on software or app interfaces.
Presenter: User Experience Researcher
Audience: Product development teams, stakeholders
5. Education:
Use: Gauging student and faculty satisfaction with educational technology.
Presenter: EdTech Coordinator
Audience: Educators, institutional leaders
6. Hospitality:
Use: Measuring guest satisfaction in hotels or restaurants.
Presenter: Operations Manager
Audience: Service staff, management
7. Real Estate:
Use: Assessing client satisfaction with property management services.
Presenter: Client Service Manager
Audience: Property managers, real estate agents
Survey questionnaire analysis digital experience ppt powerpoint presentation mockup with all 2 slides:
Use our Survey Questionnaire Analysis Digital Experience Ppt Powerpoint Presentation Mockup to effectively help you save your valuable time. They are readymade to fit into any presentation structure.
No Reviews


