Top 10 Graphical Representation PowerPoint Templates with Professional Designs
Save time and engage your audience with our fully editable PowerPoint PPT Templates and Slides.
-

Graphical Representation Of Business Financial Targets PPT Structure AT
Do not compromise on a template that erodes your messages impact. Introducing our engaging Graphical Representation Of Business Financial Targets PPT Structure AT complete deck, thoughtfully crafted to grab your audiences attention instantly. With this deck, effortlessly download and adjust elements, streamlining the customization process. Whether you are using Microsoft versions or Google Slides, it fits seamlessly into your workflow. Furthermore, it is accessible in JPG, JPEG, PNG, and PDF formats, facilitating easy sharing and editing. Not only that you also play with the color theme of your slides making it suitable as per your audiences preference.
-

Graphical Representation By Revenue Gross Profit PPT Designs AT
While your presentation may contain top-notch content, if it lacks visual appeal, you are not fully engaging your audience. Introducing our Graphical Representation By Revenue Gross Profit PPT Designs AT deck, designed to engage your audience. Our complete deck boasts a seamless blend of Creativity and versatility. You can effortlessly customize elements and color schemes to align with your brand identity. Save precious time with our pre-designed template, compatible with Microsoft versions and Google Slides. Plus, its downloadable in multiple formats like JPG, JPEG, and PNG. Elevate your presentations and outshine your competitors effortlessly with our visually stunning 100 percent editable deck.
-
Dynamic Cash Flow Statement Graphical Representation PPT Template PPT H
Do not compromise on a template that erodes your messages impact. Introducing our engaging Dynamic Cash Flow Statement Graphical Representation PPT Template PPT H complete deck, thoughtfully crafted to grab your audiences attention instantly. With this deck, effortlessly download and adjust elements, streamlining the customization process. Whether you are using Microsoft versions or Google Slides, it fits seamlessly into your workflow. Furthermore, it is accessible in JPG, JPEG, PNG, and PDF formats, facilitating easy sharing and editing. Not only that you also play with the color theme of your slides making it suitable as per your audiences preference.
-
Graphical Representation Project Tracker Report PPT Demonstration AT
Do not compromise on a template that erodes your messages impact. Introducing our engaging Graphical Representation Project Tracker Report PPT Demonstration AT complete deck, thoughtfully crafted to grab your audiences attention instantly. With this deck, effortlessly download and adjust elements, streamlining the customization process. Whether you are using Microsoft versions or Google Slides, it fits seamlessly into your workflow. Furthermore, it is accessible in JPG, JPEG, PNG, and PDF formats, facilitating easy sharing and editing. Not only that you also play with the color theme of your slides making it suitable as per your audiences preference.
-
Graphical Representation Of Employee Turnover Statistics PPT Presentation AT
Ditch the Dull templates and opt for our engaging Graphical Representation Of Employee Turnover Statistics PPT Presentation AT deck to attract your audience. Our visually striking design effortlessly combines creativity with functionality, ensuring your content shines through. Compatible with Microsoft versions and Google Slides, it offers seamless integration of presentation. Save time and effort with our pre-designed PPT layout, while still having the freedom to customize fonts, colors, and everything you ask for. With the ability to download in various formats like JPG, JPEG, and PNG, sharing your slides has never been easier. From boardroom meetings to client pitches, this deck can be the secret weapon to leaving a lasting impression.
-
Graphical Representation For Total Business Revenue PPT Summary AT
Ditch the Dull templates and opt for our engaging Graphical Representation For Total Business Revenue PPT Summary AT deck to attract your audience. Our visually striking design effortlessly combines creativity with functionality, ensuring your content shines through. Compatible with Microsoft versions and Google Slides, it offers seamless integration of presentation. Save time and effort with our pre-designed PPT layout, while still having the freedom to customize fonts, colors, and everything you ask for. With the ability to download in various formats like JPG, JPEG, and PNG, sharing your slides has never been easier. From boardroom meetings to client pitches, this deck can be the secret weapon to leaving a lasting impression.
-
Tolerance Range Graphical Representation Of Environmental PPT Sample AT
Do not compromise on a template that erodes your messages impact. Introducing our engaging Tolerance Range Graphical Representation Of Environmental PPT Sample AT complete deck, thoughtfully crafted to grab your audiences attention instantly. With this deck, effortlessly download and adjust elements, streamlining the customization process. Whether you are using Microsoft versions or Google Slides, it fits seamlessly into your workflow. Furthermore, it is accessible in JPG, JPEG, PNG, and PDF formats, facilitating easy sharing and editing. Not only that you also play with the color theme of your slides making it suitable as per your audiences preference.
-
Complaints Received Details Graphical Representation PPT Graphics AT
Ditch the Dull templates and opt for our engaging Complaints Received Details Graphical Representation PPT Graphics AT deck to attract your audience. Our visually striking design effortlessly combines creativity with functionality, ensuring your content shines through. Compatible with Microsoft versions and Google Slides, it offers seamless integration of presentation. Save time and effort with our pre designed PPT layout, while still having the freedom to customize fonts, colors, and everything you ask for. With the ability to download in various formats like JPG, JPEG, and PNG, sharing your slides has never been easier. From boardroom meetings to client pitches, this deck can be the secret weapon to leaving a lasting impression.
-
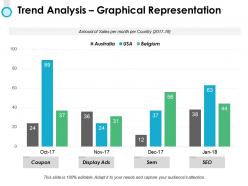
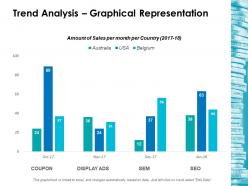
Trend Analysis Graphical Representation PPT Demonstration AT
While your presentation may contain top-notch content, if it lacks visual appeal, you are not fully engaging your audience. Introducing our Trend Analysis Graphical Representation PPT Demonstration AT deck, designed to engage your audience. Our complete deck boasts a seamless blend of Creativity and versatility. You can effortlessly customize elements and color schemes to align with your brand identity. Save precious time with our pre-designed template, compatible with Microsoft versions and Google Slides. Plus, its downloadable in multiple formats like JPG, JPEG, and PNG. Elevate your presentations and outshine your competitors effortlessly with our visually stunning 100 percent editable deck.
-
Cash Flow Statement Graphical Representation Introduction PPT Example AT
Ditch the Dull templates and opt for our engaging Cash Flow Statement Graphical Representation Introduction PPT Example AT deck to attract your audience. Our visually striking design effortlessly combines creativity with functionality, ensuring your content shines through. Compatible with Microsoft versions and Google Slides, it offers seamless integration of presentation. Save time and effort with our pre-designed PPT layout, while still having the freedom to customize fonts, colors, and everything you ask for. With the ability to download in various formats like JPG, JPEG, and PNG, sharing your slides has never been easier. From boardroom meetings to client pitches, this deck can be the secret weapon to leaving a lasting impression.
-
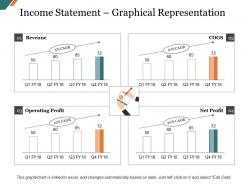
Income Statement Graphical Representation PPT Example AT
Ditch the Dull templates and opt for our engaging Income Statement Graphical Representation PPT Example AT deck to attract your audience. Our visually striking design effortlessly combines creativity with functionality, ensuring your content shines through. Compatible with Microsoft versions and Google Slides, it offers seamless integration of presentation. Save time and effort with our pre-designed PPT layout, while still having the freedom to customize fonts, colors, and everything you ask for. With the ability to download in various formats like JPG, JPEG, and PNG, sharing your slides has never been easier. From boardroom meetings to client pitches, this deck can be the secret weapon to leaving a lasting impression.
-
Graphical Representation Of Company Dividend PPT Summary AT
Step up your game with our enchanting Graphical Representation Of Company Dividend PPT Summary AT deck, guaranteed to leave a lasting impression on your audience. Crafted with a perfect balance of simplicity, and innovation, our deck empowers you to alter it to your specific needs. You can also change the color theme of the slide to mold it to your companys specific needs. Save time with our ready-made design, compatible with Microsoft versions and Google Slides. Additionally, its available for download in various formats including JPG, JPEG, and PNG. Outshine your competitors with our fully editable and customized deck.
-
Balance Sheet Graphical Representation PPT Structure AT
While your presentation may contain top-notch content, if it lacks visual appeal, you are not fully engaging your audience. Introducing our Balance Sheet Graphical Representation PPT Structure AT deck, designed to engage your audience. Our complete deck boasts a seamless blend of Creativity and versatility. You can effortlessly customize elements and color schemes to align with your brand identity. Save precious time with our pre-designed template, compatible with Microsoft versions and Google Slides. Plus, its downloadable in multiple formats like JPG, JPEG, and PNG. Elevate your presentations and outshine your competitors effortlessly with our visually stunning 100 percent editable deck.
-
Graphical Representation Of Consumer Equilibrium Using Indifference Curves PPT Information AT
Do not compromise on a template that erodes your messages impact. Introducing our engaging Graphical Representation Of Consumer Equilibrium Using Indifference Curves PPT Information AT complete deck, thoughtfully crafted to grab your audiences attention instantly. With this deck, effortlessly download and adjust elements, streamlining the customization process. Whether you are using Microsoft versions or Google Slides, it fits seamlessly into your workflow. Furthermore, it is accessible in JPG, JPEG, PNG, and PDF formats, facilitating easy sharing and editing. Not only that you also play with the color theme of your slides making it suitable as per your audiences preference.
-
A B Testing Population Graphical Representation Competitive Graphs Application
This complete presentation has PPT slides on wide range of topics highlighting the core areas of your business needs. It has professionally designed templates with relevant visuals and subject driven content. This presentation deck has total of twelve slides. Get access to the customizable templates. Our designers have created editable templates for your convenience. You can edit the colour, text and font size as per your need. You can add or delete the content if required. You are just a click to away to have this ready-made presentation. Click the download button now.
-
Graphical Representation Of Global Healthcare Supply Chain Management Service Market
This slide shows the graphical representation of global healthcare supply chain management service market. This include healthcare manufacturers, healthcare provider, distributors etc.Introducing our Graphical Representation Of Global Healthcare Supply Chain Management Service Market set of slides. The topics discussed in these slides are Healthcare Manufacturers, Segment Dominate, Total Global Market. This is an immediately available PowerPoint presentation that can be conveniently customized. Download it and convince your audience.
-
Data Representation And Interpretation PPT Graphics VA
Diving into the world of data representation and interpretation this PowerPoint graphics collection offers a vibrant selection of visually striking elements to enhance your presentation deck. Perfect for analysts and business leaders alike the customizable PPT slides empower you to simplify complex information while captivating your audience. Experience modern slide designs that facilitate clear data storytelling and effective visualization strategies. These editable slides provide an array of infographic templates and professional layouts tailored for impactful communication. Elevate your corporate presentations or consulting pitches with this unique bundle that seamlessly combines creativity and functionality ensuring your data shines through every slide.
-
Graphical Representation Of Cash Flow Forecast In Financial Analytics
The purpose of this slide is to illustrate cash flow analysis for forecasting, enhancing clarity, and aiding in strategic decision making. It also includes the methods used along with key insights on cash outflow and balance. Presenting our well structured Graphical Representation Of Cash Flow Forecast In Financial Analytics The topics discussed in this slide are Graphical Representation, Cash Flow Forecast, Financial Analytics This is an instantly available PowerPoint presentation that can be edited conveniently. Download it right away and captivate your audience.
-
R80 Analyzing Graphical Representation Of Position Statement Analysis Delivery Business Plan Ppt Example BP SS
The slides cover the snapshot of the companys financial position at a specific time by showing the details of the companys assets along with its liabilities and owners capital from the historical year 2023 till the forecasted the year 2027. Present the topic in a bit more detail with this R80 Analyzing Graphical Representation Of Position Statement Analysis Delivery Business Plan Ppt Example BP SS. Use it as a tool for discussion and navigation on Key Highlights, Total Assets, Owners Capital. This template is free to edit as deemed fit for your organization. Therefore download it now.
-
Graphical Representation Of Lead Source Used By Various Industries
This slide represents graph that provide key insights to various companies about lead sources used and select effective source for lead generation. It includes various sources such as direct mail, trade shows, blogs, PPC, etc. Presenting our well structured Graphical Representation Of Lead Source Used By Various Industries. The topics discussed in this slide are Number Respondents, Marketing Agencies, Generate Most. This is an instantly available PowerPoint presentation that can be edited conveniently. Download it right away and captivate your audience.
-
Graphical Representation Of IoT Gaming Platform Budget Transforming Future Of Gaming IoT SS
The following slide showcases statistical representation of Internet of Things IoT gaming platform cost. It includes major costs such as development, infrastructure, security measures, quality assurance, customer support, maintenance and team along with key takeaways. Present the topic in a bit more detail with this Graphical Representation Of IoT Gaming Platform Budget Transforming Future Of Gaming IoT SS. Use it as a tool for discussion and navigation on Graphical Representation, Iot Gaming Platform Budget. This template is free to edit as deemed fit for your organization. Therefore download it now.
-
Business powerpoint examples graphical representation stacked diagram 5 stages templates
We are proud to present our business powerpoint examples graphical representation stacked diagram 5 stages templates. Business Flow diagram contains stacked levels for representation of structures. This diagram an be useful for creating visually appealing charts. You can change color, size and orientation of any icon to your liking. Present your views using our innovative slides and be assured of leaving a lasting impression.
-
Introduction To Data Representation Basics PPT Graphics AT
Step up your game with our enchanting Introduction To Data Representation Basics PPT Graphics AT deck, guaranteed to leave a lasting impression on your audience. Crafted with a perfect balance of simplicity, and innovation, our deck empowers you to alter it to your specific needs. You can also change the color theme of the slide to mold it to your companys specific needs. Save time with our ready-made design, compatible with Microsoft versions and Google Slides. Additionally, its available for download in various formats including JPG, JPEG, and PNG. Outshine your competitors with our fully editable and customized deck.
-
Tolerance Range Graphical Representation Of Environmental Conditions Ppt Slides
The purpose of this slide is to highlight bell curve of tolerance range of environmental conditions that are survivable for species. It includes elements such as lower limit of tolerance, upper limit of tolerance, etc. Presenting our well structured Tolerance Range Graphical Representation Of Environmental Conditions Ppt Slides. The topics discussed in this slide are Low, Population, High. This is an instantly available PowerPoint presentation that can be edited conveniently. Download it right away and captivate your audience.
-
Graphical Representation Of Sales Numbers By Quarter
Presenting our well structured Graphical Representation Of Sales Numbers By Quarter. The topics discussed in this slide are Revenue, Sales Team, Customers. This is an instantly available PowerPoint presentation that can be edited conveniently. Download it right away and captivate your audience.
-
Api management solution api market size by region graphical representation
The following chart shows the Application Interface Management Market Analysis by region , over a period of years Deliver an outstanding presentation on the topic using this API Management Solution API Market Size By Region Graphical Representation. Dispense information and present a thorough explanation of Api Management Market Size By Region Graphical Representation using the slides given. This template can be altered and personalized to fit your needs. It is also available for immediate download. So grab it now.
-
Graphical Representation Of Macroeconomic Unemployment Rate
Introducing our Graphical Representation Of Macroeconomic Unemployment Rate set of slides. The topics discussed in these slides are US Unemployment Rate, 2012 To 2025, Demand By Consumer. This is an immediately available PowerPoint presentation that can be conveniently customized. Download it and convince your audience.
-
Digital Data Representation PPT Graphics VA
Diving into the world of digital data representation this PowerPoint graphics template is a gamechanger for effective visual storytelling. With an array of editable slides your corporate presentations will captivate the audience while effectively conveying complex information. The modern slide design infused within this presentation deck ensures that your data visualization is not just attractive but also impactful. Ideal for strategy decks or consulting presentations these dynamic visuals let you present insights with clarity. Elevate your pitch deck with professional PPT themes that enhance your storytelling process allowing for seamless engagement and interaction in any setting.
-
Product roadmap timeline 2013 to 2018 graphical representation of technologies powerpoint templates slides
Ready to use template theme which saves time also , Fully customizable Presentation designs, text, font, colors and layout, Unaffected High resolution PPT slides even after customization, Well compatible with all the software’s and Google slides, Graphical visuals to incisively penetrate audience, Convertible into PDF or JPG formats, Easy to replace dummy PPT images with your logo or trademark.
-
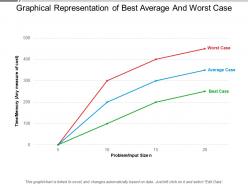
Graphical representation of best average and worst case
Presenting this set of slides with name - Graphical Representation Of Best Average And Worst Case. This is a three stage process. The stages in this process are Best Worst Case, Bad Case, Top Worst Case.
-
1013 business ppt diagram graphical representation of technologies powerpoint template
We are proud to present our 1013 business ppt diagram graphical representation of technologies powerpoint template. Use this PowerPoint Diagram for business, educational topics, marketing research, technology, etc. This Business Flow diagram consists steps and levels for representation of relationships and structures. Create captivating presentations to deliver comparative and weighted arguments.
-
Financial targets graphical representation
Presenting this set of slides with name Financial Targets Graphical Representation . This is a three stage process. The stages in this process are Financial Target, Financial Target Objectives, Financial Targets Sales. This is a completely editable PowerPoint presentation and is available for immediate download. Download now and impress your audience.
-
Visualizing Migration Political And Social Spatial Representations PPT Graphics AT
Step up your game with our enchanting Visualizing Migration Political And Social Spatial Representations PPT Graphics AT deck, guaranteed to leave a lasting impression on your audience. Crafted with a perfect balance of simplicity, and innovation, our deck empowers you to alter it to your specific needs. You can also change the color theme of the slide to mold it to your companys specific needs. Save time with our ready-made design, compatible with Microsoft versions and Google Slides. Additionally, its available for download in various formats including JPG, JPEG, and PNG. Outshine your competitors with our fully editable and customized deck.
-
Graphical representation of business kpi with employee working on data doing calculations
Presenting this set of slides with name - Graphical Representation Of Business Kpi With Employee Working On Data Doing Calculations. This is a four stage process. The stages in this process are Business Kpi, Business Dashboard, Business Metrics.
-
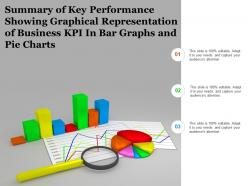
Summary of key performance showing graphical representation of business kpi in bar graphs and pie charts
Presenting this set of slides with name - Summary Of Key Performance Showing Graphical Representation Of Business Kpi In Bar Graphs And Pie Charts. This is a three stage process. The stages in this process are Business Kpi, Business Dashboard, Business Metrics.
-
Graphical representation of data using statistical measures
Introducing our premium set of slides with Graphical Representation Of Data Using Statistical Measures. Elucidate the four stages and present information using this PPT slide. This is a completely adaptable PowerPoint template design that can be used to interpret topics like Graphical Representation Of Data Using Statistical Measures. So download instantly and tailor it with your information.
-
Pharmaceutical Sales For New Representatives PPT Graphics AT
Do not compromise on a template that erodes your messages impact. Introducing our engaging Pharmaceutical Sales For New Representatives PPT Graphics AT complete deck, thoughtfully crafted to grab your audiences attention instantly. With this deck, effortlessly download and adjust elements, streamlining the customization process. Whether you are using Microsoft versions or Google Slides, it fits seamlessly into your workflow. Furthermore, it is accessible in JPG, JPEG, PNG, and PDF formats, facilitating easy sharing and editing. Not only that you also play with the color theme of your slides making it suitable as per your audiences preference.
-
Graphical representation of resource optimization technique
Presenting this set of slides with name Graphical Representation Of Resource Optimization Technique. The topics discussed in these slides are Resource Optimization, Cloud Computing, Graphical Representation. This is a completely editable PowerPoint presentation and is available for immediate download. Download now and impress your audience.
-
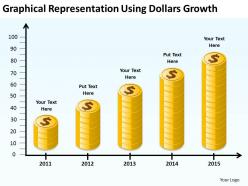
Graphical representation using dollars growth ppt powerpoint slides
We are proud to present our graphical representation using dollars growth ppt powerpoint slides. This PowerPoint slide is a graphical representation of increasing levels of business using dollars. Deliver amazing presentations to mesmerize your audience. You can easily edit the size, percentages, text, color.
-
Common Network Topologies And Their Representations PPT Graphics AT
Ditch the Dull templates and opt for our engaging Common Network Topologies And Their Representations PPT Graphics AT deck to attract your audience. Our visually striking design effortlessly combines creativity with functionality, ensuring your content shines through. Compatible with Microsoft versions and Google Slides, it offers seamless integration of presentation. Save time and effort with our pre-designed PPT layout, while still having the freedom to customize fonts, colors, and everything you ask for. With the ability to download in various formats like JPG, JPEG, and PNG, sharing your slides has never been easier. From boardroom meetings to client pitches, this deck can be the secret weapon to leaving a lasting impression.
-
Current state vs future state with the graphical representation
Presenting this set of slides with name - Current State Vs Future State With The Graphical Representation. This is a two stage process. The stages in this process are Before After, Current Vs Future, Past Present Future.
-
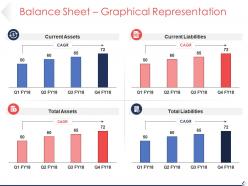
Balance sheet graphical representation sample of ppt
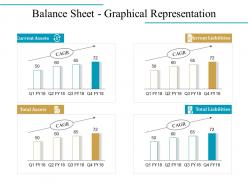
Presenting balance sheet graphical representation sample of ppt. This is a balance sheet graphical representation sample of ppt. This is a four stage process. The stages in this process are current assets, current liabilities, total assets, total liabilities.
-
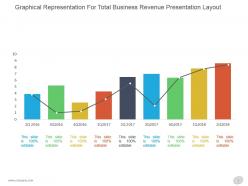
Graphical representation for total business revenue presentation layout
Presenting graphical representation for total business revenue presentation layout. This is a graphical representation for total business revenue presentation layout. This is a nine stage process. The stages in this process are graph, success, business, marketing, growth, management.
-
Circular For Financial Data Representation PPT Graphics AT
Do not compromise on a template that erodes your messages impact. Introducing our engaging Circular For Financial Data Representation PPT Graphics AT complete deck, thoughtfully crafted to grab your audiences attention instantly. With this deck, effortlessly download and adjust elements, streamlining the customization process. Whether you are using Microsoft versions or Google Slides, it fits seamlessly into your workflow. Furthermore, it is accessible in JPG, JPEG, PNG, and PDF formats, facilitating easy sharing and editing. Not only that you also play with the color theme of your slides making it suitable as per your audiences preference.
-
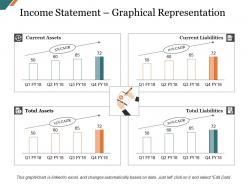
Income statement graphical representation presentation visual aids
Presenting this set of slides with name - Income Statement Graphical Representation Presentation Visual Aids. This is a four stage process. The stages in this process are Current Assets, Current Liabilities, Total Assets, Total Liabilities.
-
Mastering Representation Types For Impact PPT Graphics AT
While your presentation may contain top-notch content, if it lacks visual appeal, you are not fully engaging your audience. Introducing our Mastering Representation Types For Impact PPT Graphics AT deck, designed to engage your audience. Our complete deck boasts a seamless blend of Creativity and versatility. You can effortlessly customize elements and color schemes to align with your brand identity. Save precious time with our pre-designed template, compatible with Microsoft versions and Google Slides. Plus, its downloadable in multiple formats like JPG, JPEG, and PNG. Elevate your presentations and outshine your competitors effortlessly with our visually stunning 100 percent editable deck.
-
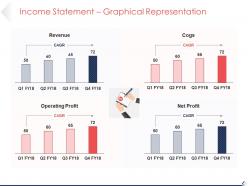
Income statement graphical representation presentation slides
Presenting this set of slides with name - Income Statement Graphical Representation Presentation Slides. This is a four stage process. The stages in this process are Revenue, Cogs, Operating Profit, Net Profit.
-
Income statement graphical representation ppt icon
Presenting this set of slides with name - Income Statement Graphical Representation Ppt Icon. This is a four stage process. The stages in this process are Revenue, Operating Profit, Cogs, Net Profit, Business.
-
Business Process Chart Representation For PPT Graphics AT
While your presentation may contain top notch content, if it lacks visual appeal, you are not fully engaging your audience. Introducing our Business Process Chart Representation For PPT Graphics AT deck, designed to engage your audience. Our complete deck boasts a seamless blend of Creativity and versatility. You can effortlessly customize elements and color schemes to align with your brand identity. Save precious time with our pre designed template, compatible with Microsoft versions and Google Slides. Plus, its downloadable in multiple formats like JPG, JPEG, and PNG. Elevate your presentations and outshine your competitors effortlessly with our visually stunning 100 percent editable deck.
-
Income statement graphical representation powerpoint slides
Presenting income statement graphical representation powerpoint slides. This is a income statement graphical representation powerpoint slides. This is a four stage process. The stages in this process are revenue, cogs, operating profit, net profit.
-
Trend analysis graphical representation ppt powerpoint presentation gallery design ideas
Presenting this set of slides with name - Trend Analysis Graphical Representation Ppt Powerpoint Presentation Gallery Design Ideas. This is a four stage process. The stages in this process are Percentage, Product, Business, Management, Marketing.
-
Trend analysis graphical representation ppt layouts graphics
Presenting this set of slides with name - Trend Analysis Graphical Representation Ppt Layouts Graphics. This is a four stage process. The stages in this process are Business, Management, Strategy, Analysis, Marketing.
-
Balance sheet graphical representation ppt pictures graphics tutorials
Presenting this set of slides with name - Balance Sheet Graphical Representation Ppt Pictures Graphics Tutorials. This is a four stage process. The stages in this process are Current Assets, Current Liabilities, Total Assets, Total Liabilities.
-
Cash flow statement graphical representation ppt slides example introduction
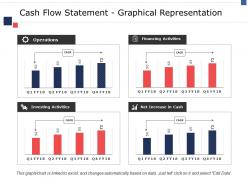
Presenting this set of slides with name - Cash Flow Statement Graphical Representation Ppt Slides Example Introduction. This is a four stage process. The stages in this process are Bar Chart, Marketing, Strategy, Planning, Finance.
-
Balance sheet graphical representation good ppt example
Presenting this set of slides with name - Balance Sheet Graphical Representation Good Ppt Example. This is a four stage process. The stages in this process are Current Assets, Current Liabilities, Total Liabilities, Total Assets, Business.
-
Cash flow statement graphical representation ppt model visual aids
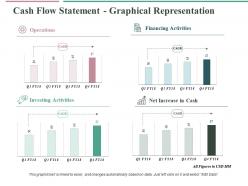
Presenting this set of slides with name - Cash Flow Statement Graphical Representation Ppt Model Visual Aids. This is a four stage process. The stages in this process are Operations, Financing Activities, Investing Activities, Net Increase In Cash.
-
Inverted Pyramid For Sales Funnel Representation PPT Graphics AT
Step up your game with our enchanting Inverted Pyramid For Sales Funnel Representation PPT Graphics AT deck, guaranteed to leave a lasting impression on your audience. Crafted with a perfect balance of simplicity, and innovation, our deck empowers you to alter it to your specific needs. You can also change the color theme of the slide to mold it to your companys specific needs. Save time with our ready-made design, compatible with Microsoft versions and Google Slides. Additionally, its available for download in various formats including JPG, JPEG, and PNG. Outshine your competitors with our fully editable and customized deck.
-
Balance sheet graphical representation ppt slides demonstration
Presenting this set of slides with name - Balance Sheet Graphical Representation Ppt Slides Demonstration. This is a four stage process. The stages in this process are Bar Chart, Marketing, Strategy, Planning, Finance.
-
Market survey graphical representation ppt model
Presenting this set of slides with name - Market Survey Graphical Representation Ppt Model. This is a five stage process. The stages in this process are Business, Marketing, Measurement, Strategy, Finance.
-
Graphical Presentation in Research PPT Presentation VA
Turning dense research into something an audience actually remembers is the hardest part of any academic or corporate presentation. Your findings deserve more than plain bullet points and that is exactly where a thoughtfully crafted graphical presentation in research changes everything. Data visualization becomes your storyteller guiding viewers through complex concepts with clarity and purpose. This PPT slides collection offers creative layouts and presentation graphics built specifically for showcasing studies surveys and technical experiments. From infographic templates to modern slide design every editable slide helps you emphasize key discoveries without overwhelming your listeners. Give your next presentation deck the visual impact that makes your data speak and watch your audience connect with your conclusions instantly.