


Training playbook template determine workforce training performance tracking dashboard





Try Before you Buy Download Free Sample Product
 Impress Your
Audience
 100%
Editable
 Save Hours
of Time


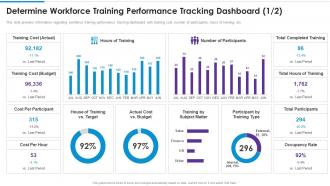
This slide provides information regarding workforce training performance tracking dashboard with training cost, number of participants, hours of training, etc.
People who downloaded this PowerPoint presentation also viewed the following :
Training playbook template determine workforce training performance tracking dashboard with all 7 slides:
Use our Training Playbook Template Determine Workforce Training Performance Tracking Dashboard to effectively help you save your valuable time. They are readymade to fit into any presentation structure.






FAQs for Training playbook template determine workforce training
Key metrics include completion rates, assessment scores, time-to-completion, learner engagement levels, skill proficiency improvements, and training ROI measurements. These metrics enable organizations to streamline program effectiveness, identify knowledge gaps, and optimize resource allocation, with many companies finding that comprehensive dashboards ultimately deliver enhanced employee performance and measurable business outcomes.
Data visualizations enhance training outcomes understanding by transforming complex performance metrics into intuitive charts, graphs, heat maps, and trend analyses that reveal patterns invisible in raw data. These visual tools enable training managers and executives to quickly identify skill gaps, track learner progress, and measure ROI across departments, ultimately delivering faster decision-making and more strategic resource allocation for competitive advantage.
**INPUT**: What tools are most effective for creating a training performance dashboard? **OUTPUT**: Effective training performance dashboard tools include Tableau, Power BI, Google Analytics, LMS-integrated platforms like Cornerstone OnDemand, and specialized solutions such as Articulate Rise and TalentLMS. These platforms streamline data visualization, automate progress tracking, and integrate multiple learning sources, with many organizations finding that comprehensive dashboards enhance training ROI, accelerate skill development, and deliver measurable performance improvements across departments. [Word count: 60]
Organizations can tailor dashboards by customizing metrics like completion rates, skill assessments, engagement scores, and ROI measurements to align with specific objectives. Through configurable widgets, role-based access controls, and industry-specific templates, companies streamline training oversight, enhance learner progress tracking, and deliver targeted insights, ultimately enabling strategic workforce development and competitive advantage.
Real-time data enables immediate assessment of training effectiveness by tracking engagement levels, completion rates, knowledge retention scores, and skill application metrics as they occur. This immediate feedback allows organizations to quickly identify struggling participants, adjust content delivery methods, and optimize learning pathways, ultimately delivering faster skill development and improved training ROI across departments.
Participant feedback integrates through automated survey systems, real-time polling tools, sentiment analysis of comments, post-session evaluations, and mobile feedback apps. These mechanisms enable trainers to capture qualitative insights alongside quantitative metrics, with many organizations finding that this comprehensive approach enhances program effectiveness, identifies improvement areas, and ultimately delivers more targeted training experiences.
Training success benchmarks include completion rates, knowledge retention scores, skill application metrics, employee engagement levels, and performance improvement indicators. These assessments enable organizations to measure learning effectiveness through pre-and-post training evaluations, on-the-job behavior changes, and business impact measurements, with many companies finding that combining quantitative metrics with qualitative feedback delivers comprehensive insights into training ROI and strategic workforce development.
Training performance dashboards identify skill gaps by analyzing completion rates, assessment scores, competency mapping, and learning pathway progress across departments and roles. Through real-time analytics and comparative reporting, organizations can pinpoint underperforming areas, track individual versus team capabilities, and benchmark against industry standards, ultimately enabling targeted training interventions and strategic workforce development initiatives.
User engagement metrics reveal critical insights into learner behavior, content effectiveness, participation rates, completion patterns, and knowledge retention levels. These metrics enable training managers to identify disengaged participants, optimize content delivery, personalize learning paths, and improve overall program ROI, with many organizations finding that higher engagement directly correlates with better performance outcomes.
Training performance dashboards support compliance and certification tracking by centralizing employee progress monitoring, automating renewal alerts, and generating audit-ready reports for regulatory requirements. These systems streamline compliance management by tracking completion rates, identifying skill gaps, and maintaining detailed certification records, with many organizations finding that automated tracking reduces administrative overhead while ensuring workforce qualification standards are consistently met.
Common pitfalls include overwhelming users with excessive metrics, displaying irrelevant KPIs that don't align with learning objectives, poor visual hierarchy that obscures key insights, and lack of actionable data filters. While comprehensive data seems valuable, organizations increasingly find that focused dashboards with clear learning progression indicators, completion rates, and skill improvement metrics deliver better training outcomes and higher user engagement.
Dashboards facilitate better decision-making by providing real-time analytics on learner engagement, completion rates, skill assessments, knowledge retention metrics, and ROI calculations. Through comprehensive data visualization, organizations can identify training gaps, optimize content delivery methods, and allocate resources more strategically, ultimately enabling HR teams to design targeted programs that deliver measurable business outcomes.
Storytelling can be incorporated into training dashboards through narrative progress flows, milestone celebrations, learner journey visualizations, comparative performance stories, and achievement timelines that create emotional engagement. These storytelling elements transform data into compelling narratives, helping organizations enhance learner motivation, improve knowledge retention, and deliver more impactful training experiences, with many finding that story-driven dashboards significantly boost completion rates.
Dashboards align training initiatives with business objectives by tracking key performance indicators, measuring skill development impact, and monitoring return on training investments through real-time analytics. These platforms enable organizations to visualize training effectiveness across departments, identify skill gaps that directly impact business goals, and adjust learning strategies accordingly, ultimately delivering improved performance metrics and competitive advantage.
Continuous improvement in training performance requires implementing regular assessment cycles, gathering participant feedback, analyzing performance metrics, updating content based on industry changes, and benchmarking against best practices. Organizations enhance their training effectiveness by establishing feedback loops, conducting post-training evaluations, and leveraging data analytics to identify knowledge gaps, ultimately delivering more targeted learning experiences and measurable skill development outcomes.
-
Great experience, I would definitely use your services further.
-
Thanks for all your great templates they have saved me lots of time and accelerate my presentations. Great product, keep them up!