Understanding market dynamics to influence buyer purchasing decisions complete deck
Check out our professionally designed Understanding Market Dynamics To Influence Buyer Purchasing Decisions template that will benefit businesses by understanding their market and competitor dynamics. Companies can use this section to illustrate their target market size and sales enablement practices. With goals for the go-to-market success slide, a company can set various goals to achieve its business objectives. Understanding the market dynamics and competitive landscape sections will assist organizations in addressing valuable information about their market outlook, projections, adoption restraints, drivers, and traits behind business success. Businesses can determine technology adoption trends and create ideal customer profiles by utilizing the targeting and segmentation section. To successfully introduce the new sales enablement plan, companies can take the help of slides, namely introducing next-generation sales enablement plan, sales enablement role matrix, and the sections, technology buying cycle, buying journey, and go to market plan. Finally, the performance tracking dashboards section will help the companies monitor sales opportunities and measure sales representatives performance. Customize this 100 percent editable template now.
Check out our professionally designed Understanding Market Dynamics To Influence Buyer Purchasing Decisions template that w..
- Google Slides is a new FREE Presentation software from Google.
- All our content is 100% compatible with Google Slides.
- Just download our designs, and upload them to Google Slides and they will work automatically.
- Amaze your audience with SlideTeam and Google Slides.
-
Want Changes to This PPT Slide? Check out our Presentation Design Services
- WideScreen Aspect ratio is becoming a very popular format. When you download this product, the downloaded ZIP will contain this product in both standard and widescreen format.
-

- Some older products that we have may only be in standard format, but they can easily be converted to widescreen.
- To do this, please open the SlideTeam product in Powerpoint, and go to
- Design ( On the top bar) -> Page Setup -> and select "On-screen Show (16:9)” in the drop down for "Slides Sized for".
- The slide or theme will change to widescreen, and all graphics will adjust automatically. You can similarly convert our content to any other desired screen aspect ratio.
Compatible With Google Slides

Get This In WideScreen
You must be logged in to download this presentation.
PowerPoint presentation slides
This complete deck covers various topics and highlights important concepts. It has PPT slides which cater to your business needs. This complete deck presentation emphasizes Understanding Market Dynamics To Influence Buyer Purchasing Decisions Complete Deck and has templates with professional background images and relevant content. This deck consists of total of sixty two slides. Our designers have created customizable templates, keeping your convenience in mind. You can edit the color, text and font size with ease. Not just this, you can also add or delete the content if needed. Get access to this fully editable complete presentation by clicking the download button below.
People who downloaded this PowerPoint presentation also viewed the following :
Content of this Powerpoint Presentation
Slide 1: This slide introduces Understanding Market Dynamics to Influence Buyer Purchasing Decisions. State Your Company Name and begin.
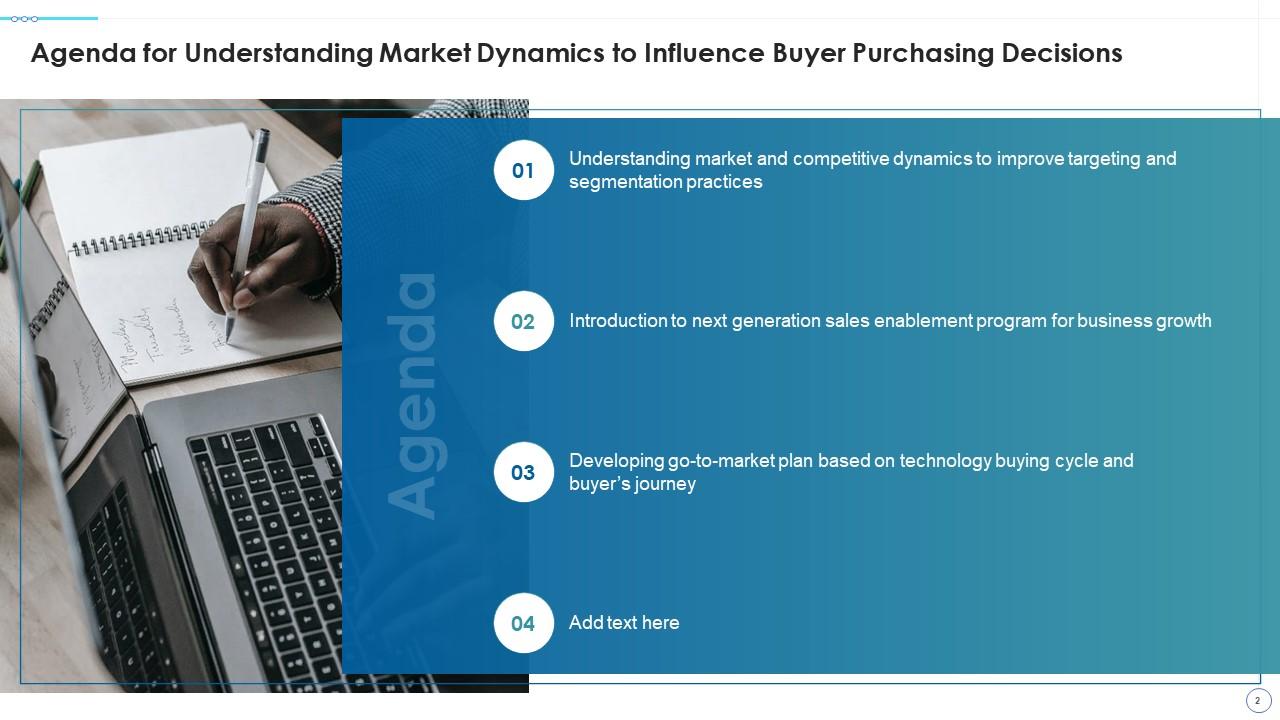
Slide 2: This is an Agenda slide. State your agendas here.
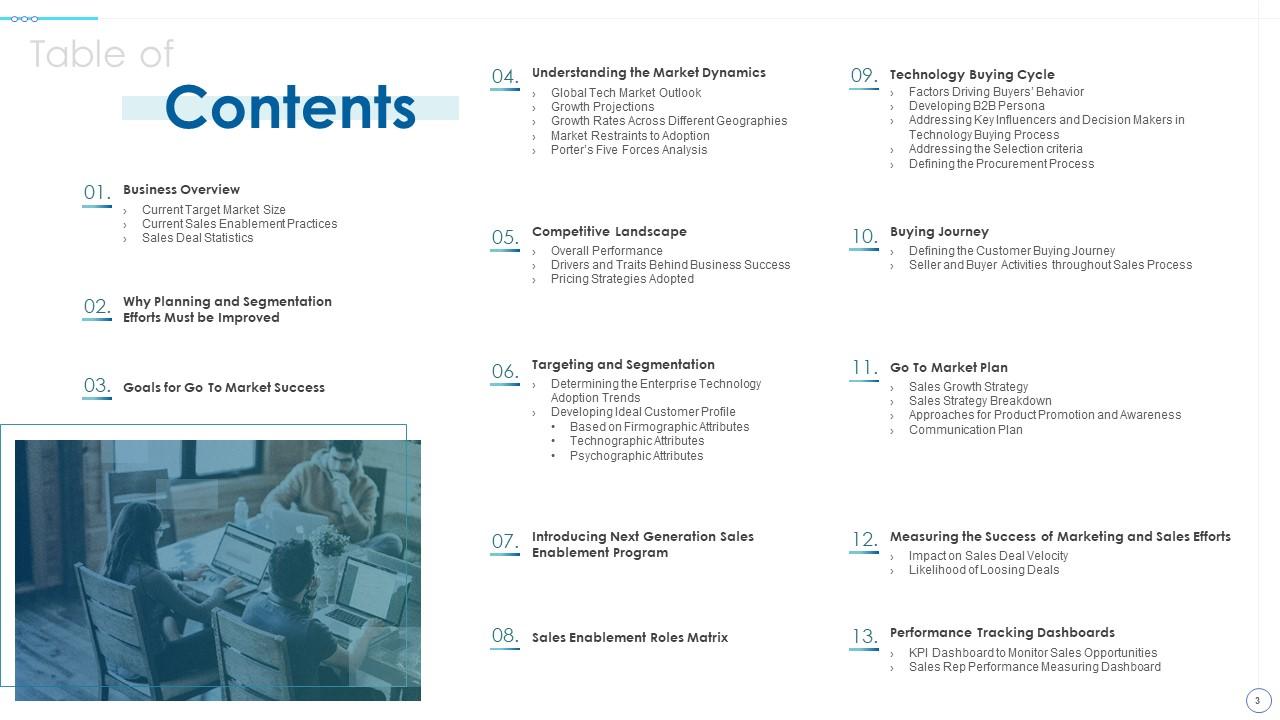
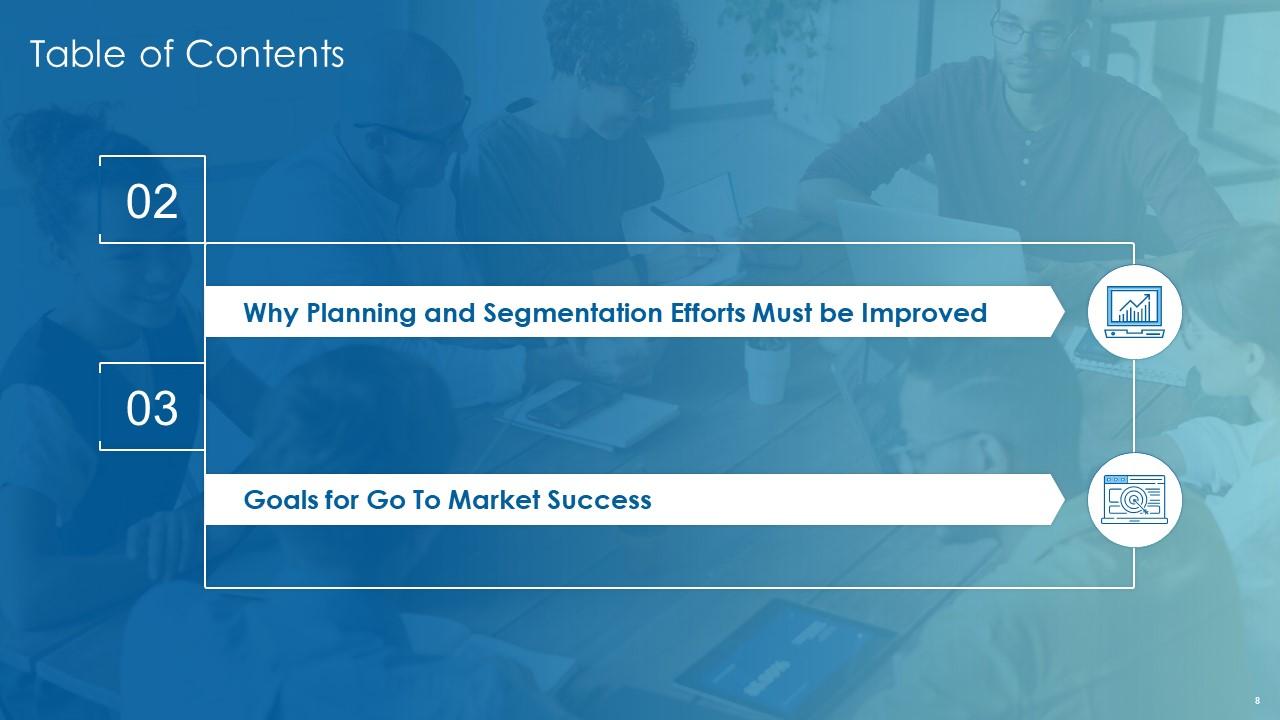
Slide 3: This slide presents Table of Content for the presentation.
Slide 4: This slide highlights title for topics that are to be covered next in the template.
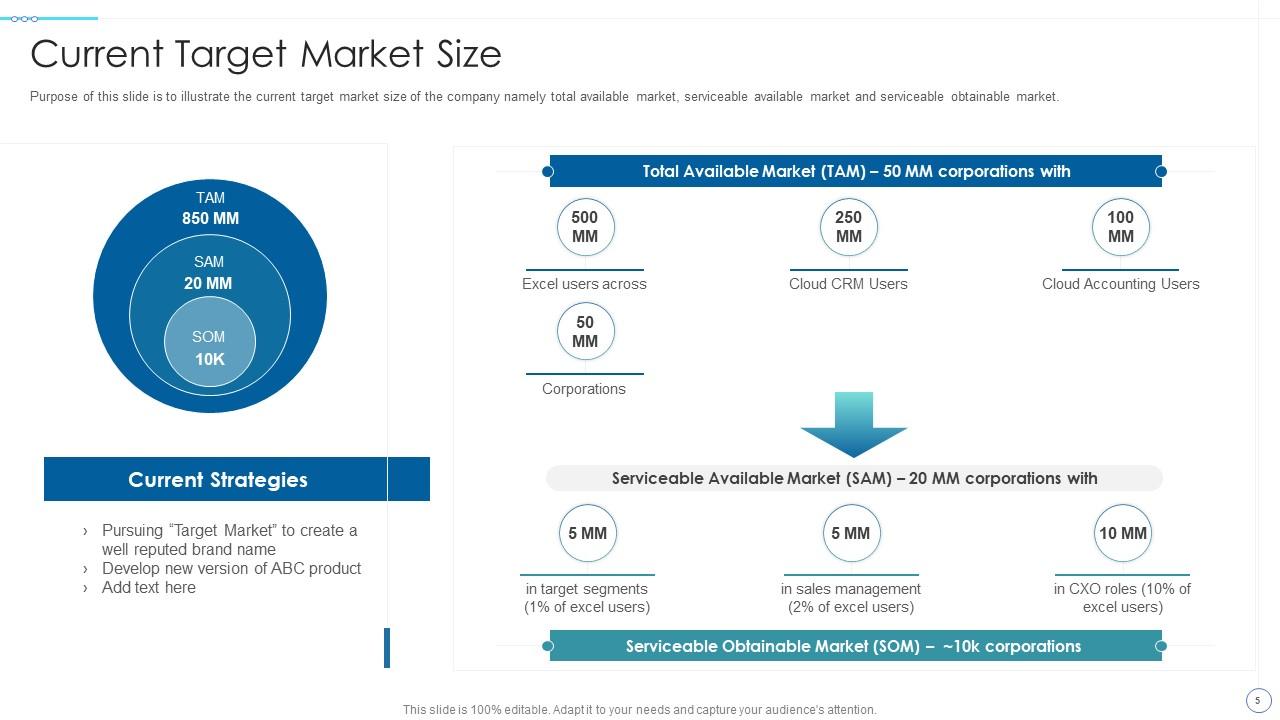
Slide 5: This slide illustrate the current target market size of the company.
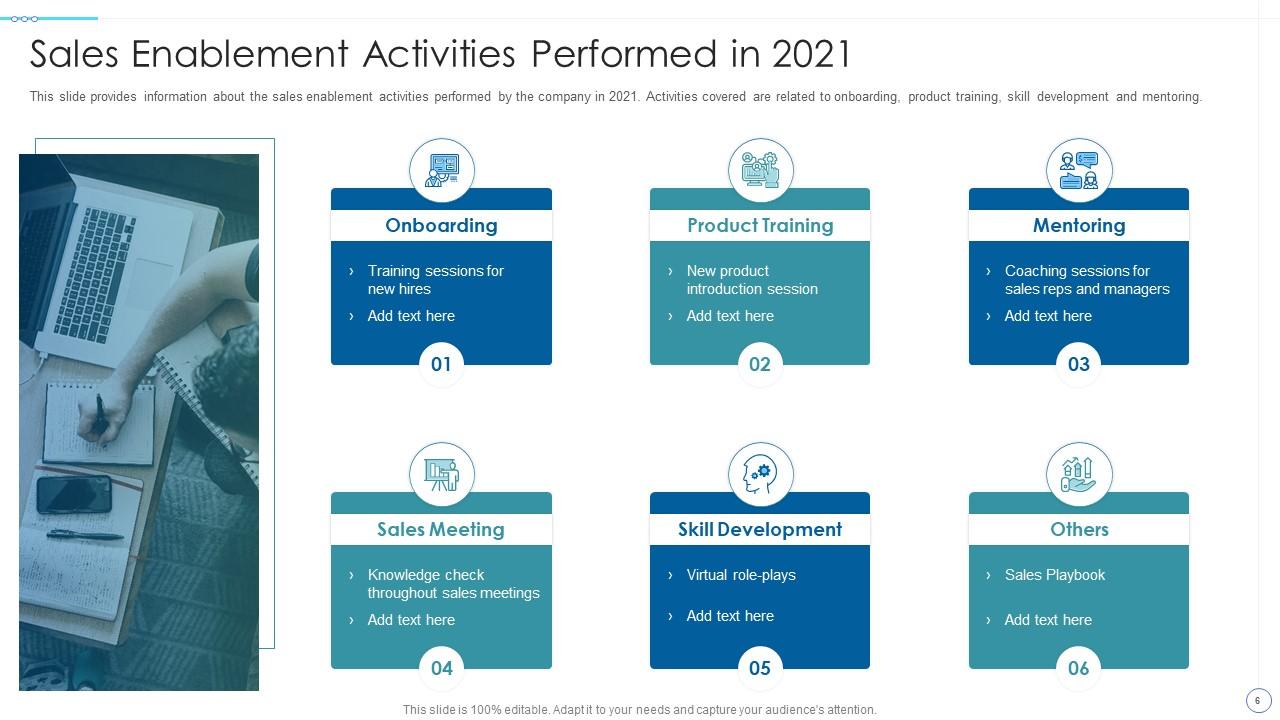
Slide 6: This slide describes sales enablement activities performed by the company in 2021.
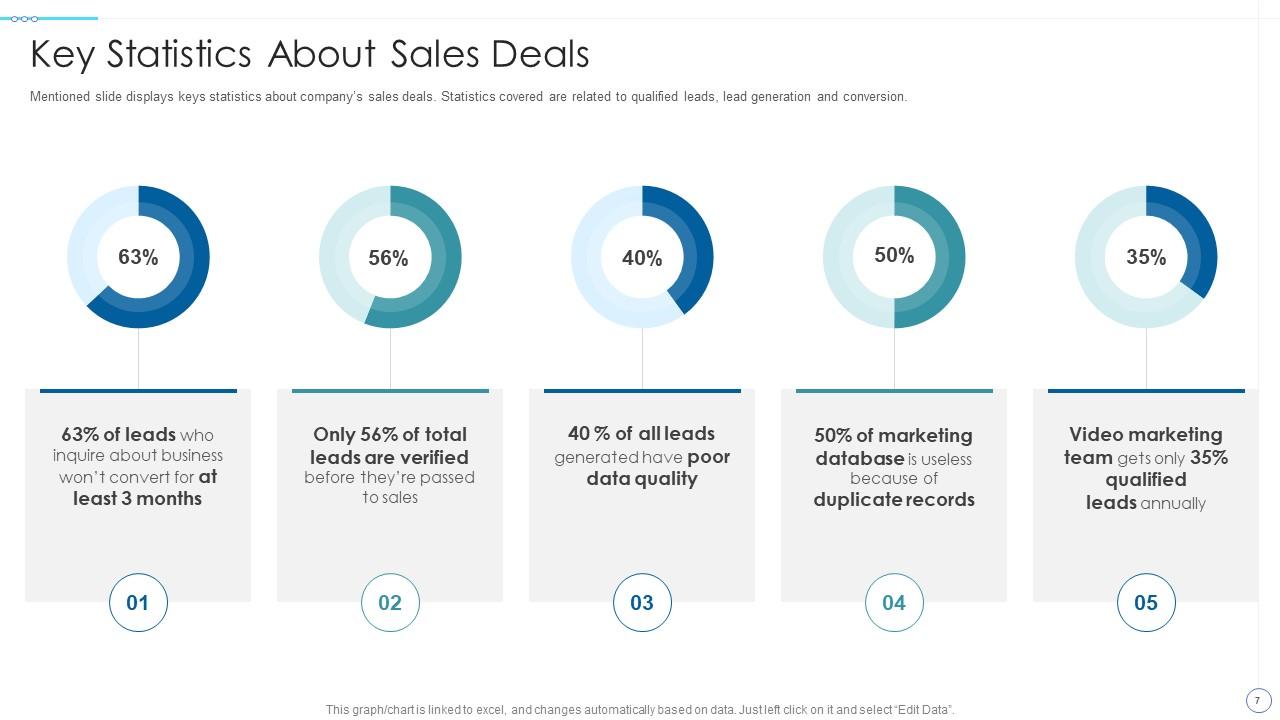
Slide 7: This slide displays keys statistics about company’s sales deals.
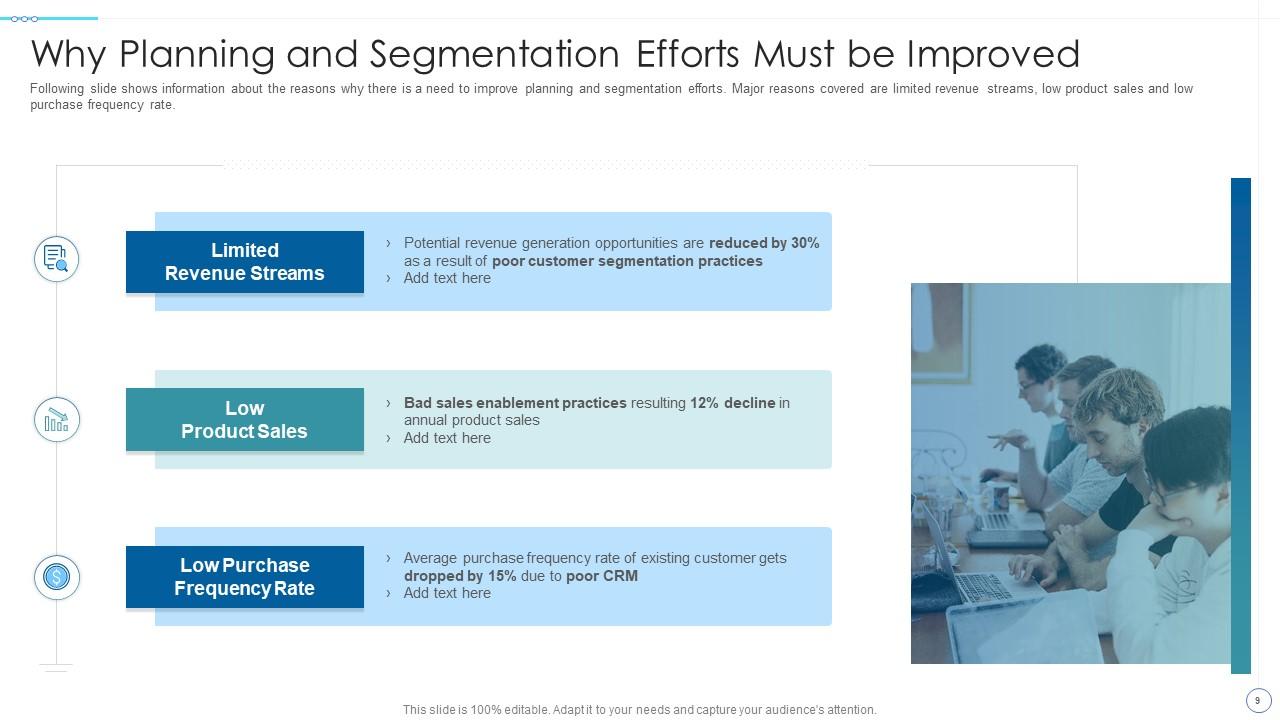
Slide 9: This slide shows information about the reasons why there is a need to improve planning and segmentation efforts.
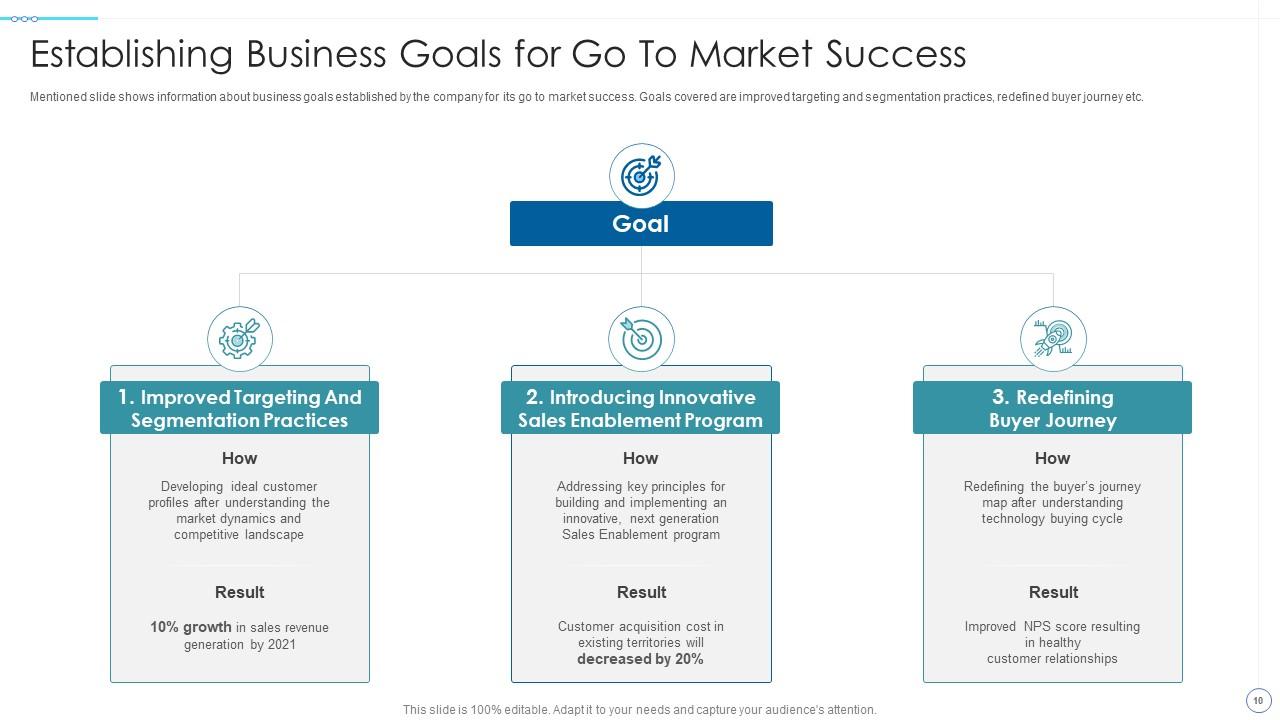
Slide 10: This slide explains business goals established by the company for its go to market success.
Slide 11: This slide presents title for Understanding the market dynamics.
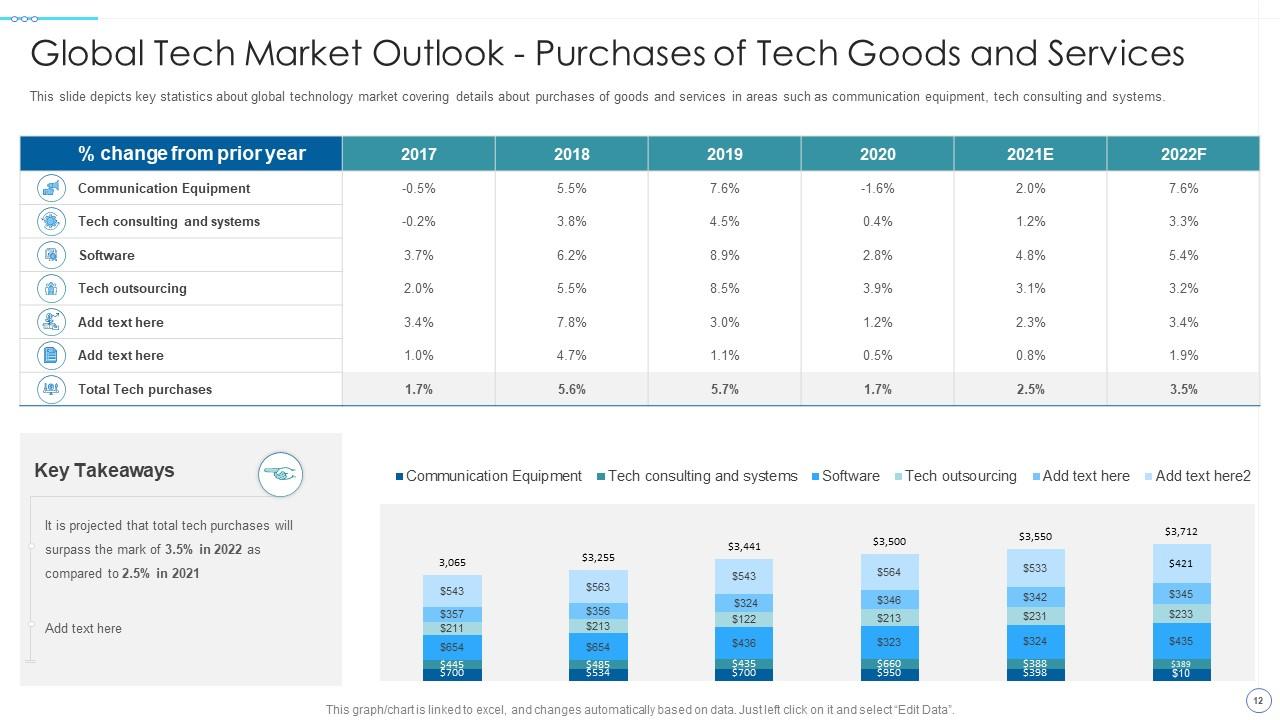
Slide 12: This slide depicts key statistics about global technology market.
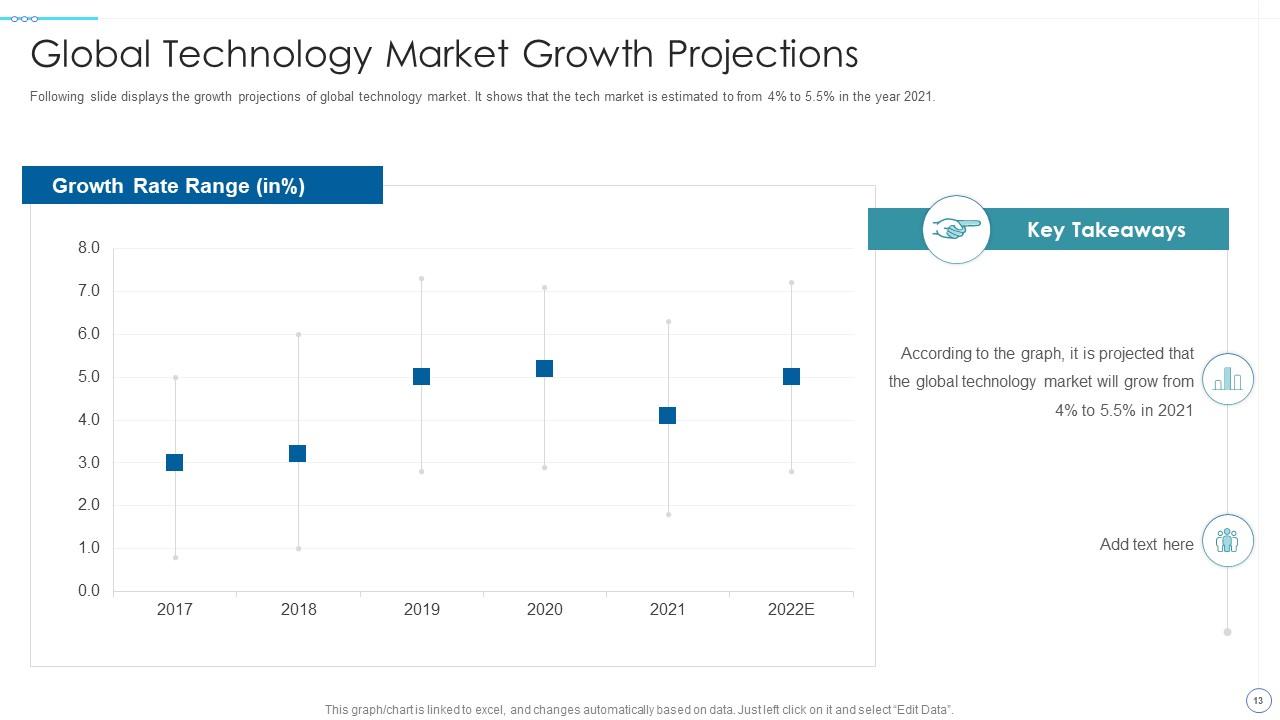
Slide 13: This slide displays the growth projections of global technology market.
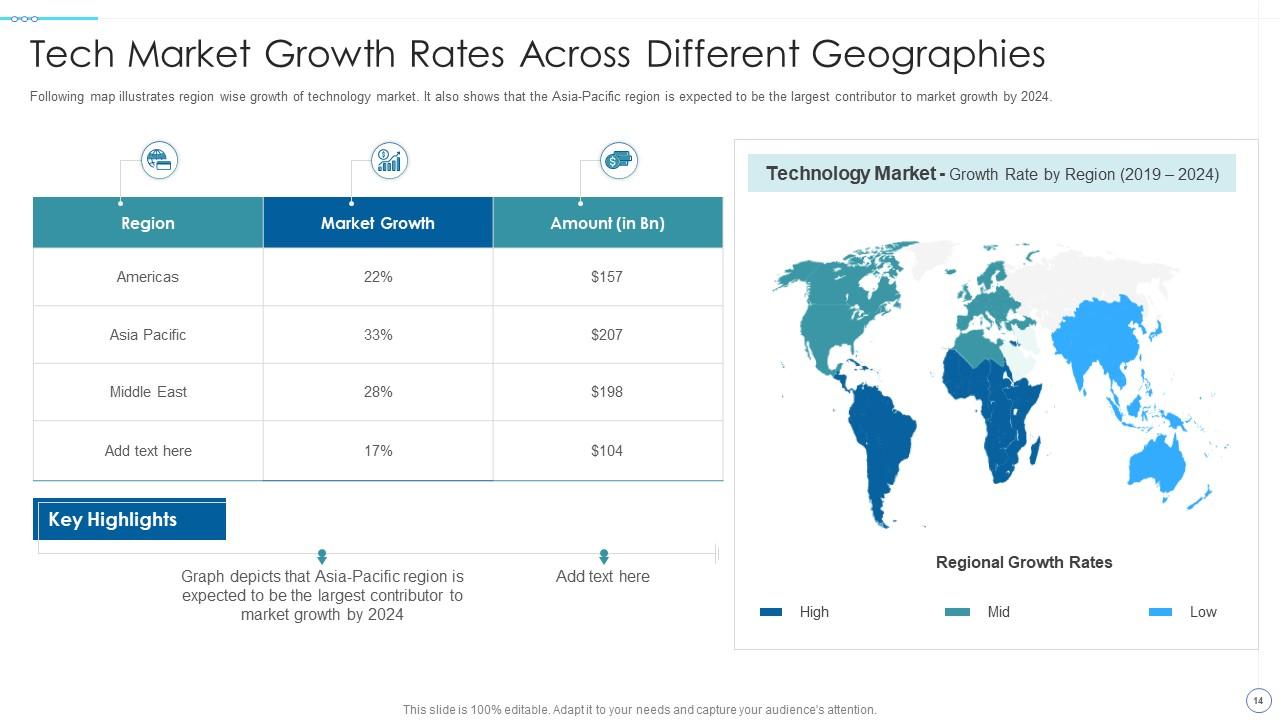
Slide 14: This slide shows map illustrating region wise growth of technology market.
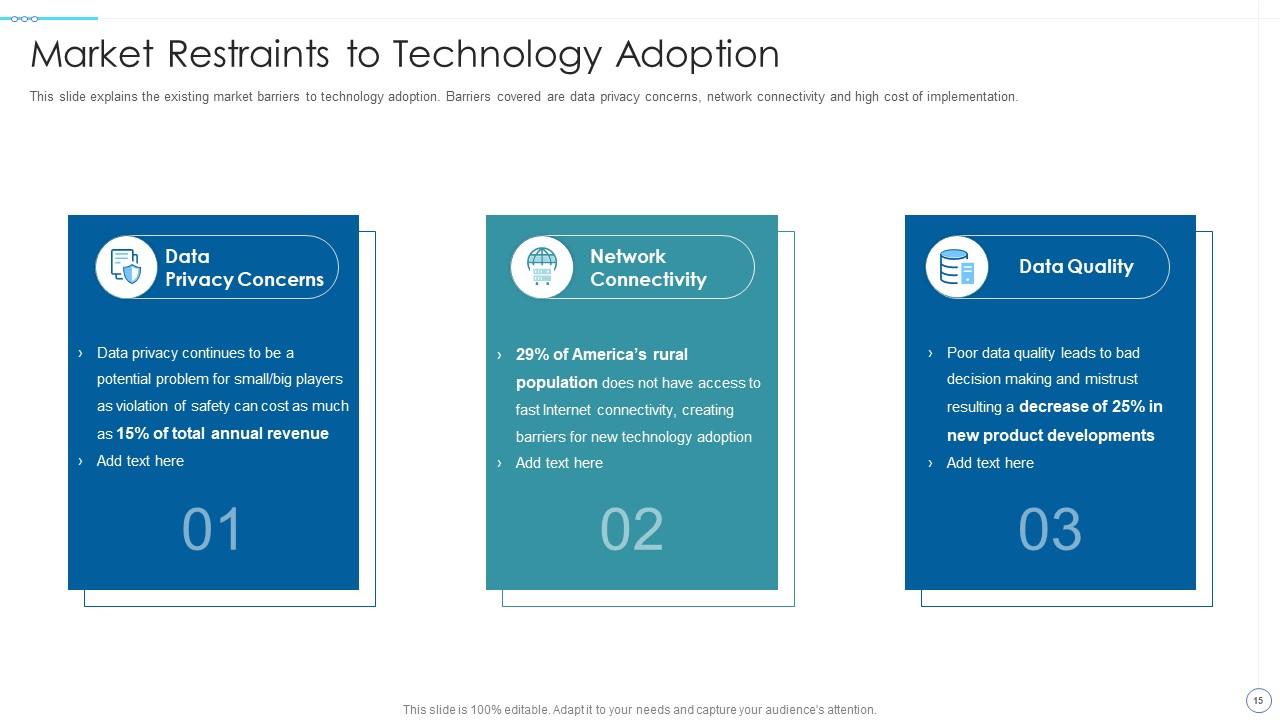
Slide 15: This slide presents existing market barriers to technology adoption.
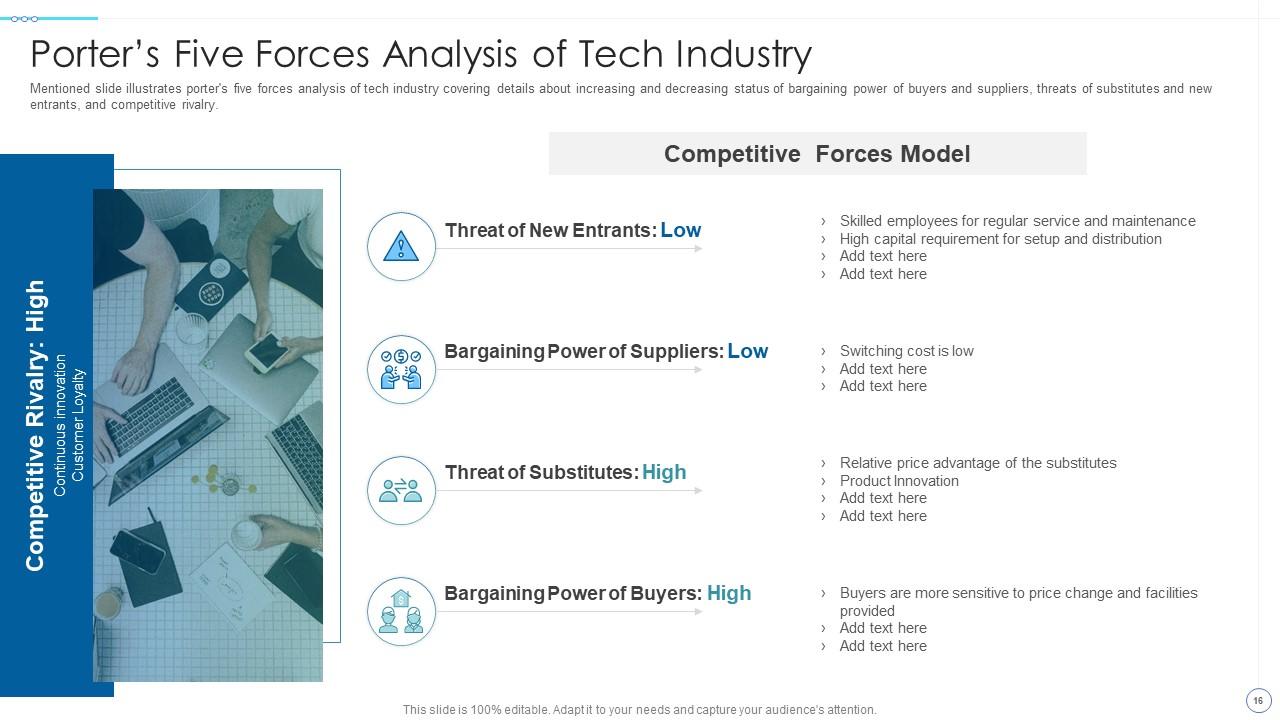
Slide 16: This slide illustrates porter's five forces analysis of tech industry.
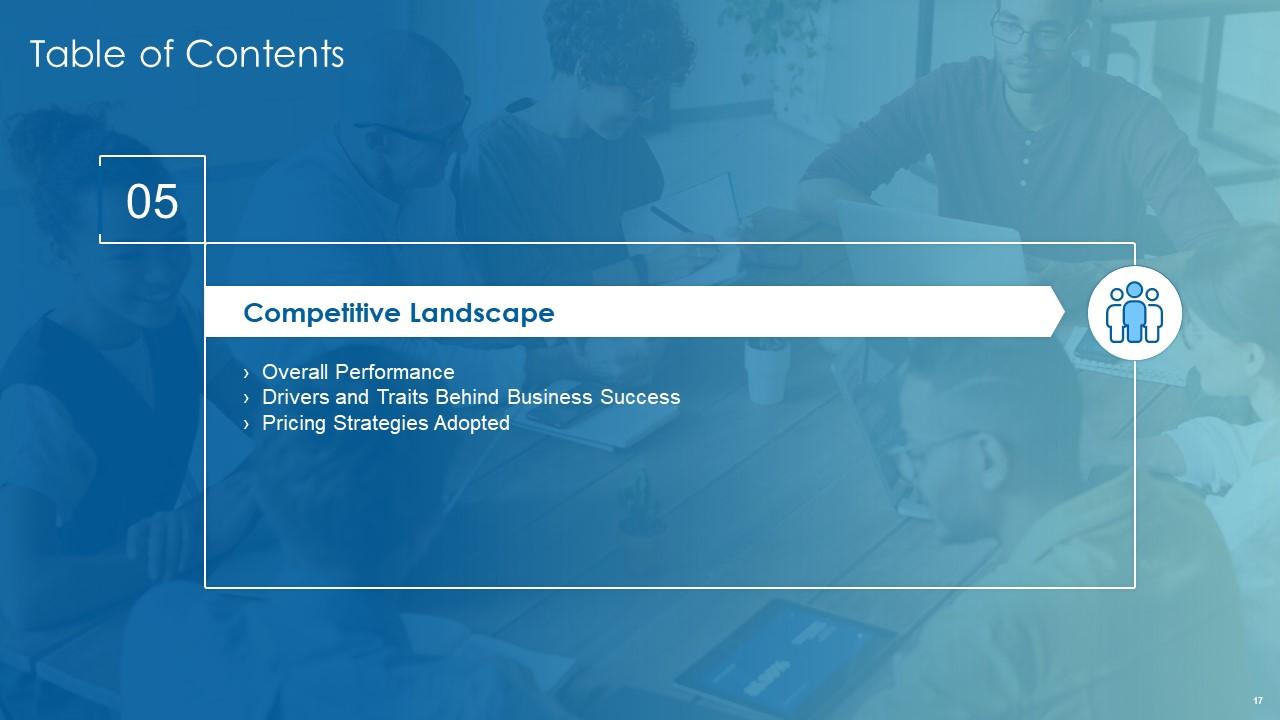
Slide 17: This slide exhibits Competitive Landscape.
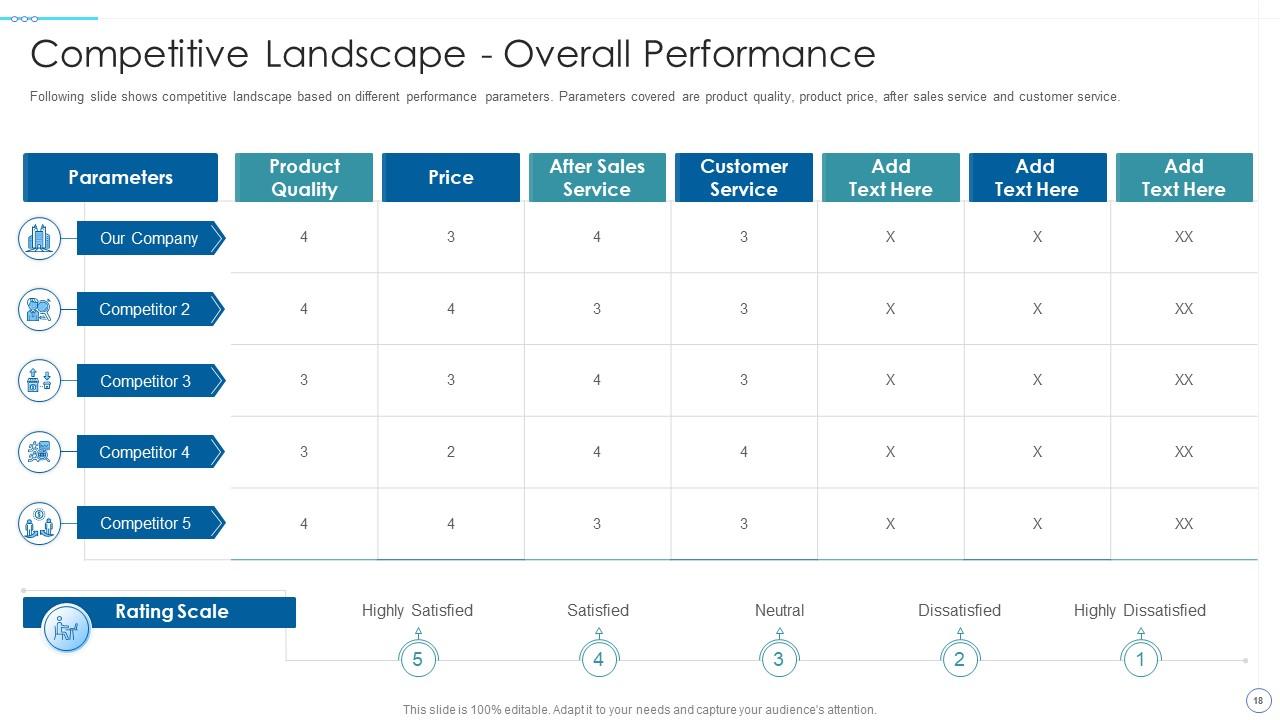
Slide 18: This slide shows competitive landscape based on different performance parameters.
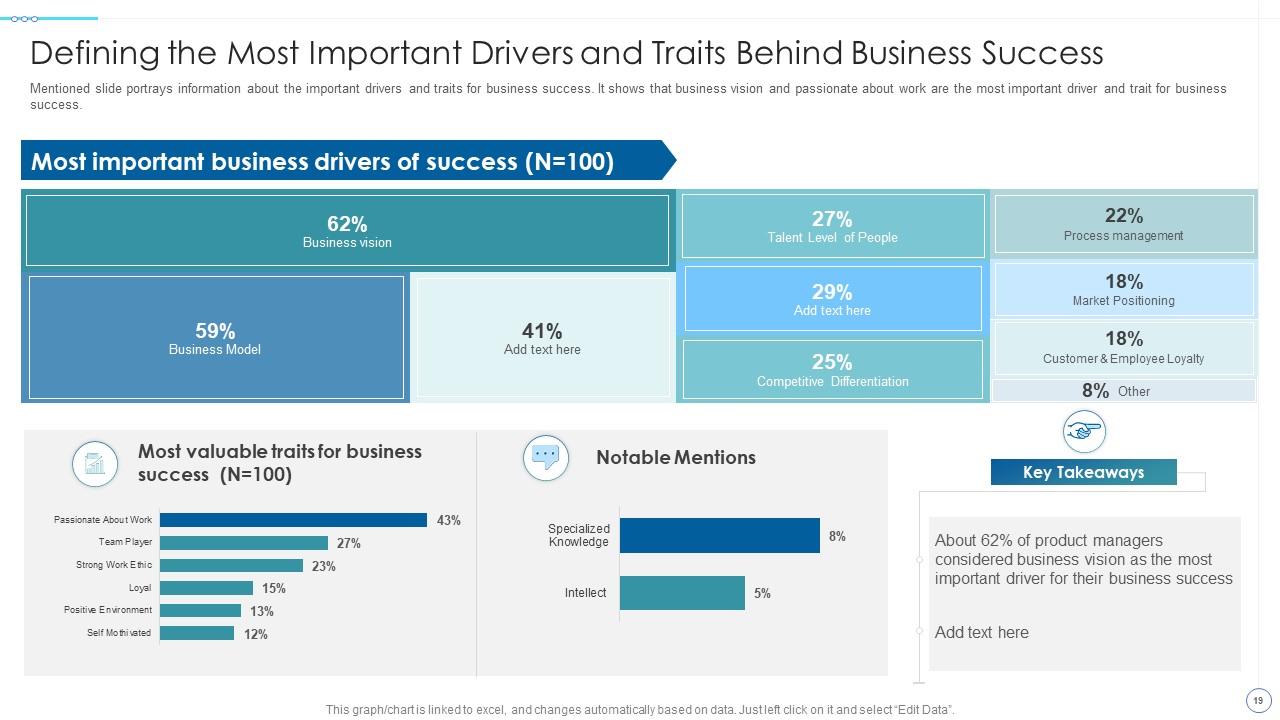
Slide 19: This slide portrays information about the important drivers and traits for business success.
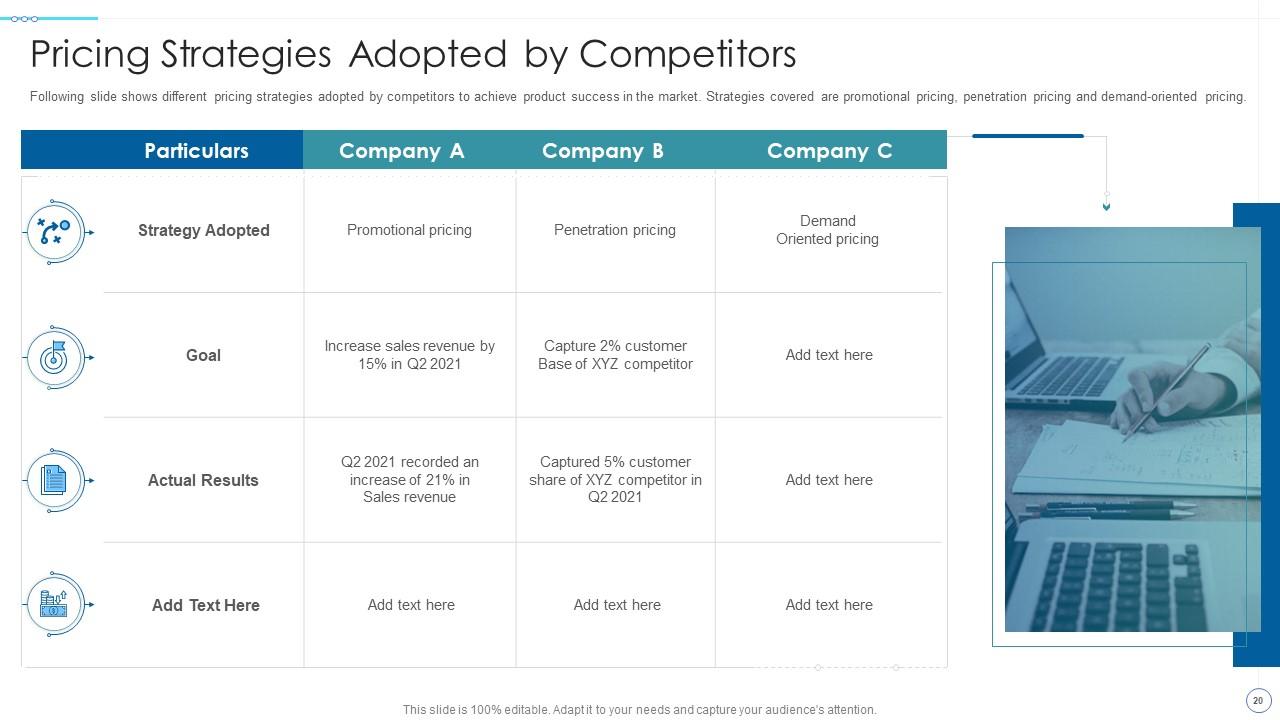
Slide 20: This slide shows different pricing strategies adopted by competitors to achieve product success in the market.
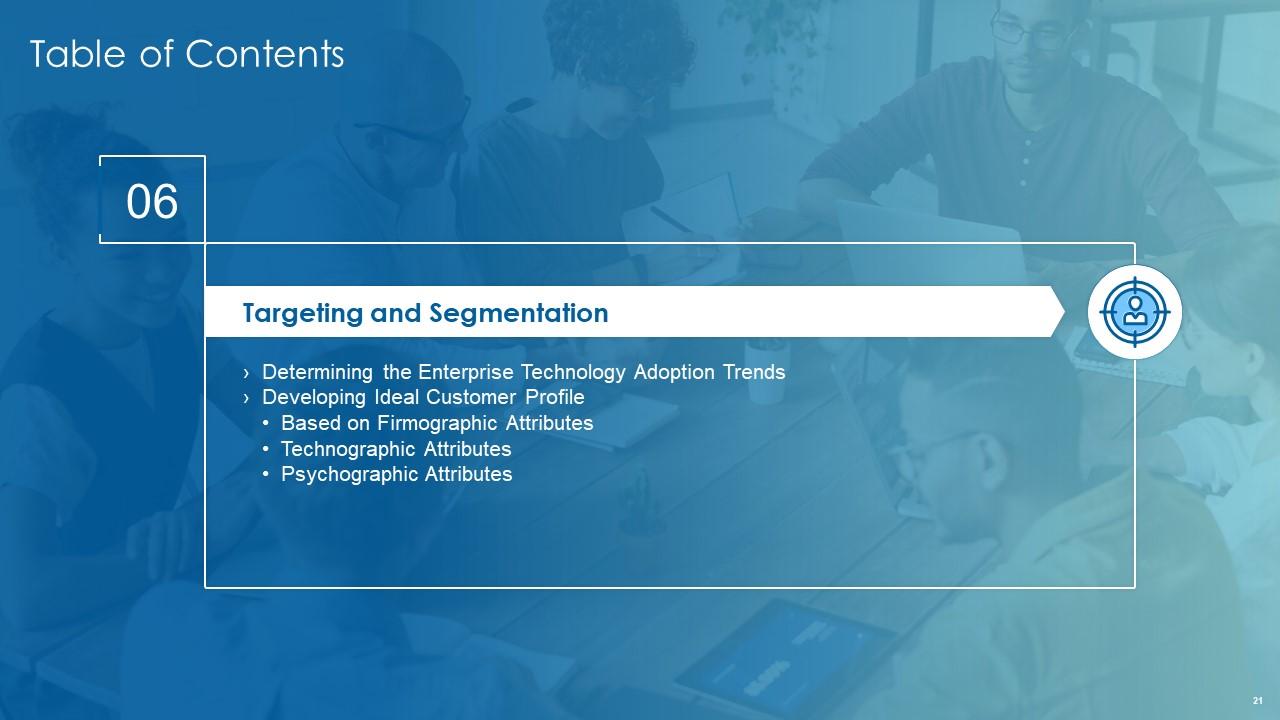
Slide 21: This slide exhibits title for Targeting and Segmentation.
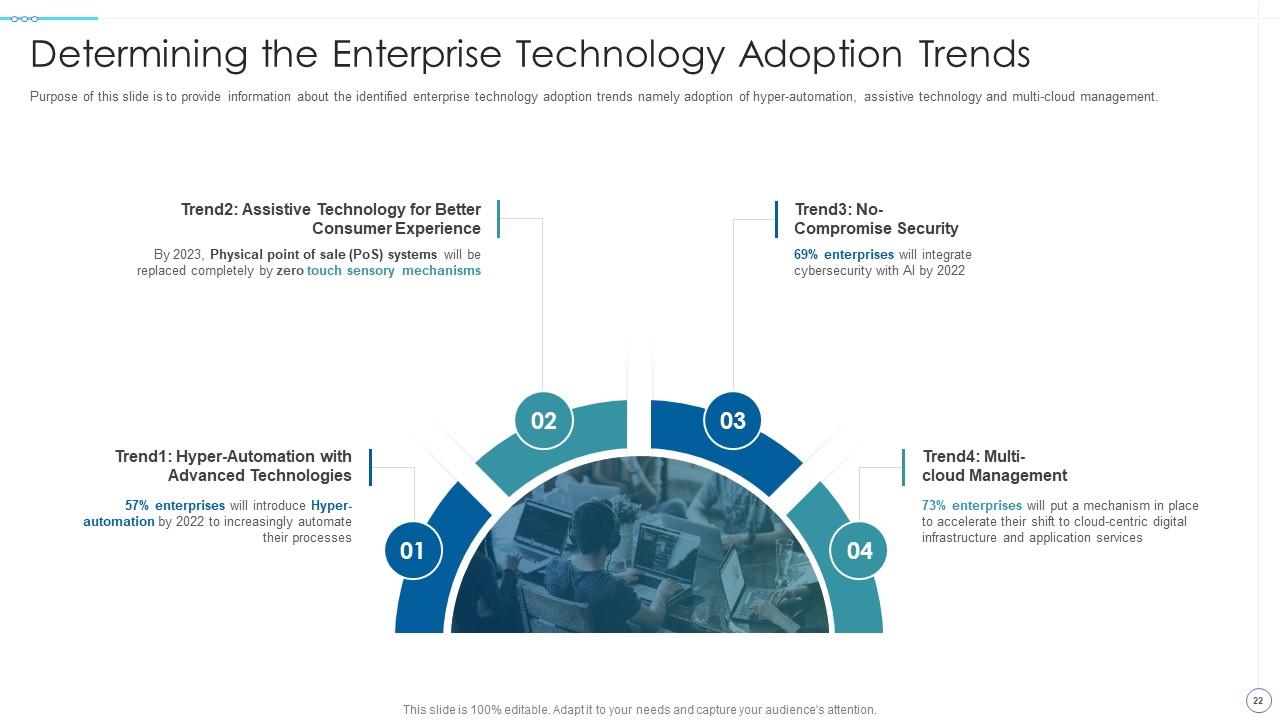
Slide 22: This slide presents identified enterprise technology adoption trends.
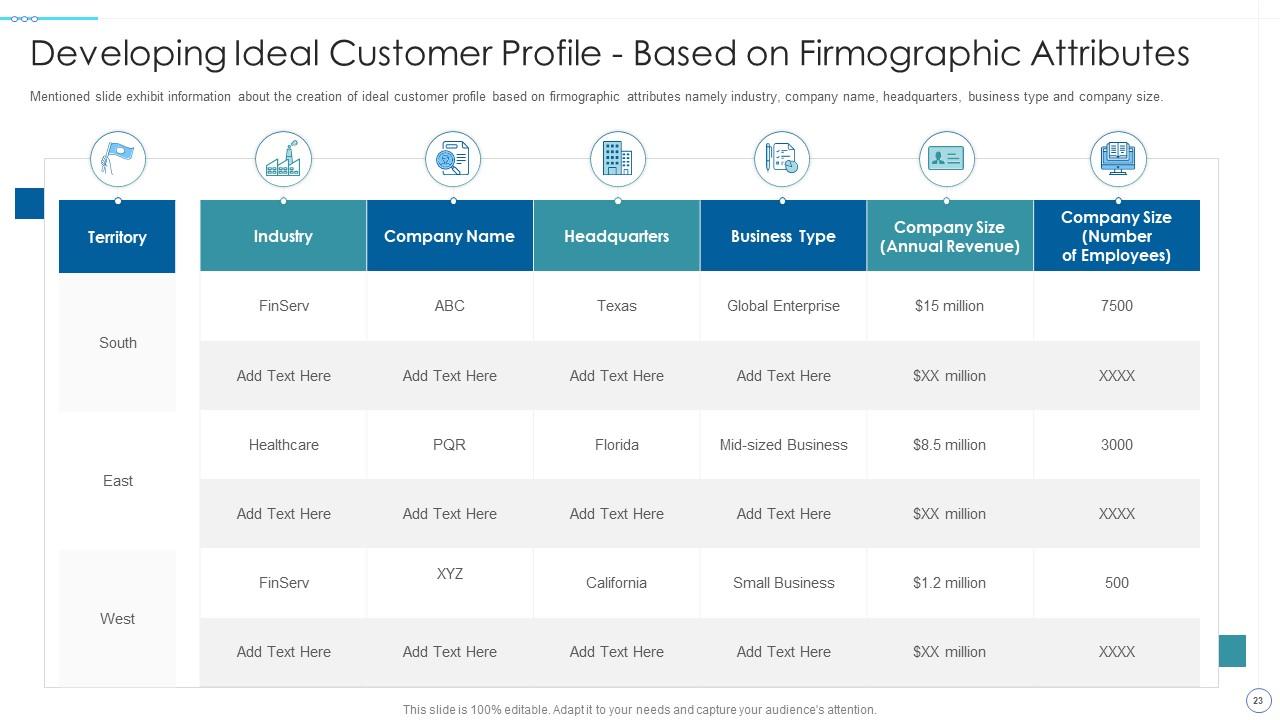
Slide 23: This slide displays creation of ideal customer profile based on firmographic attributes namely industry, company name, etc.
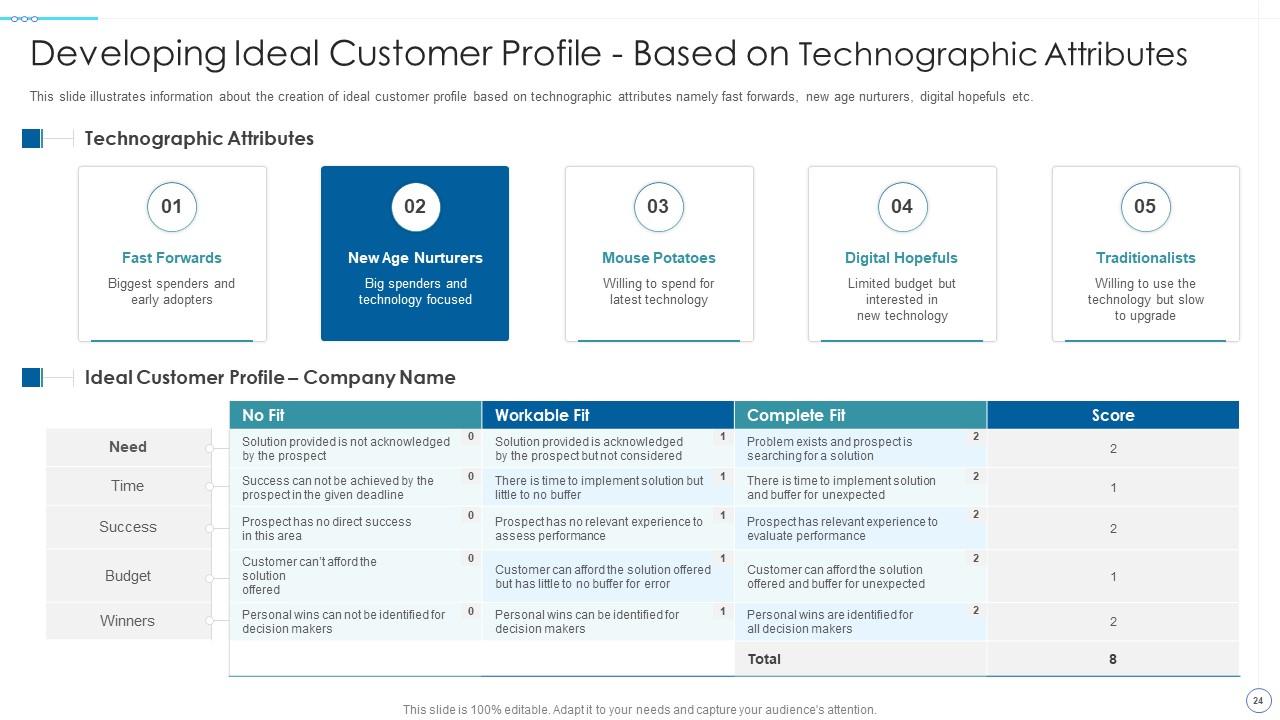
Slide 24: This slide illustrates information about the creation of ideal customer profile based on technographic attributes.
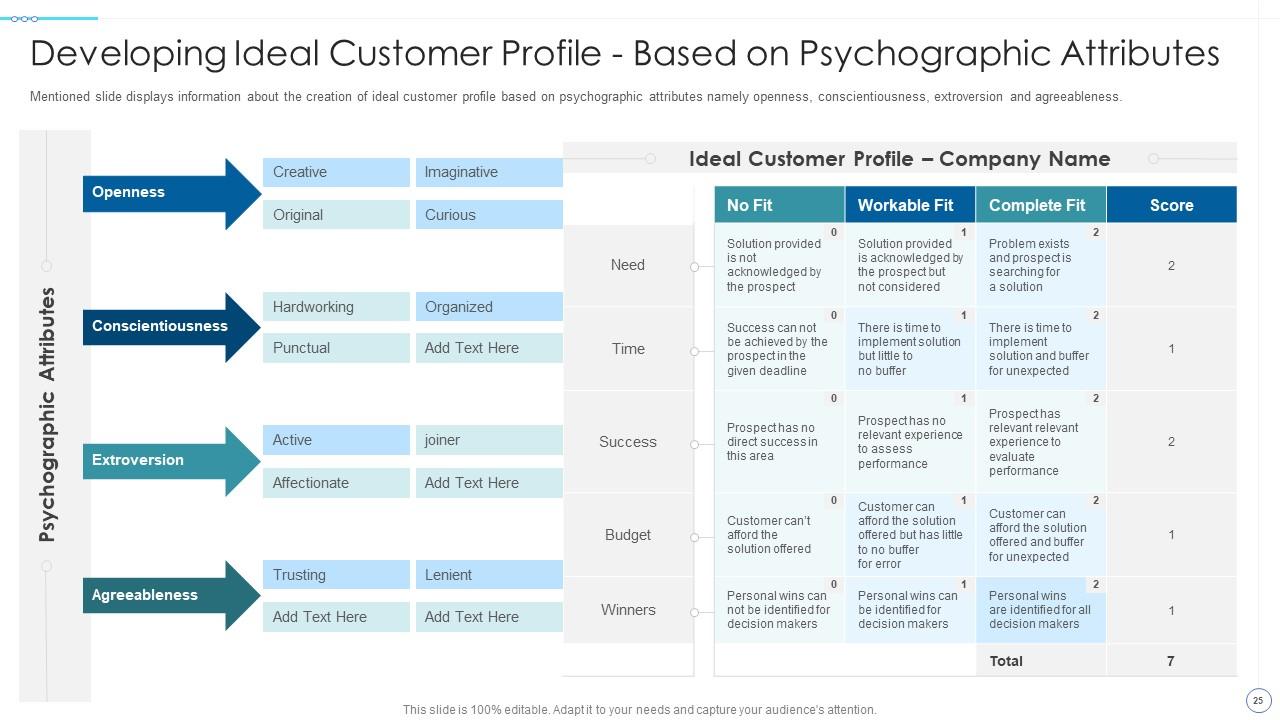
Slide 25: This slide presents creation of ideal customer profile based on psychographic attributes.
Slide 26: This slide shows title for sales enablement roles matrix.
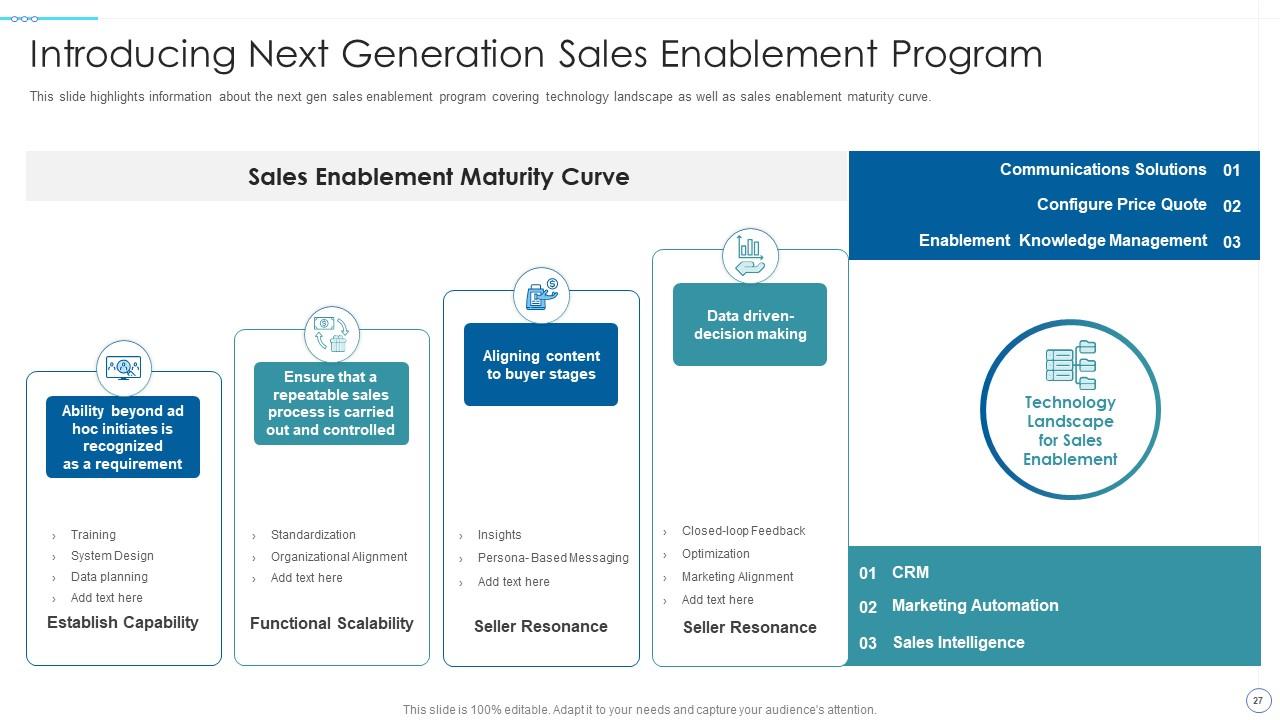
Slide 27: This slide highlights information about the next gen sales enablement program.
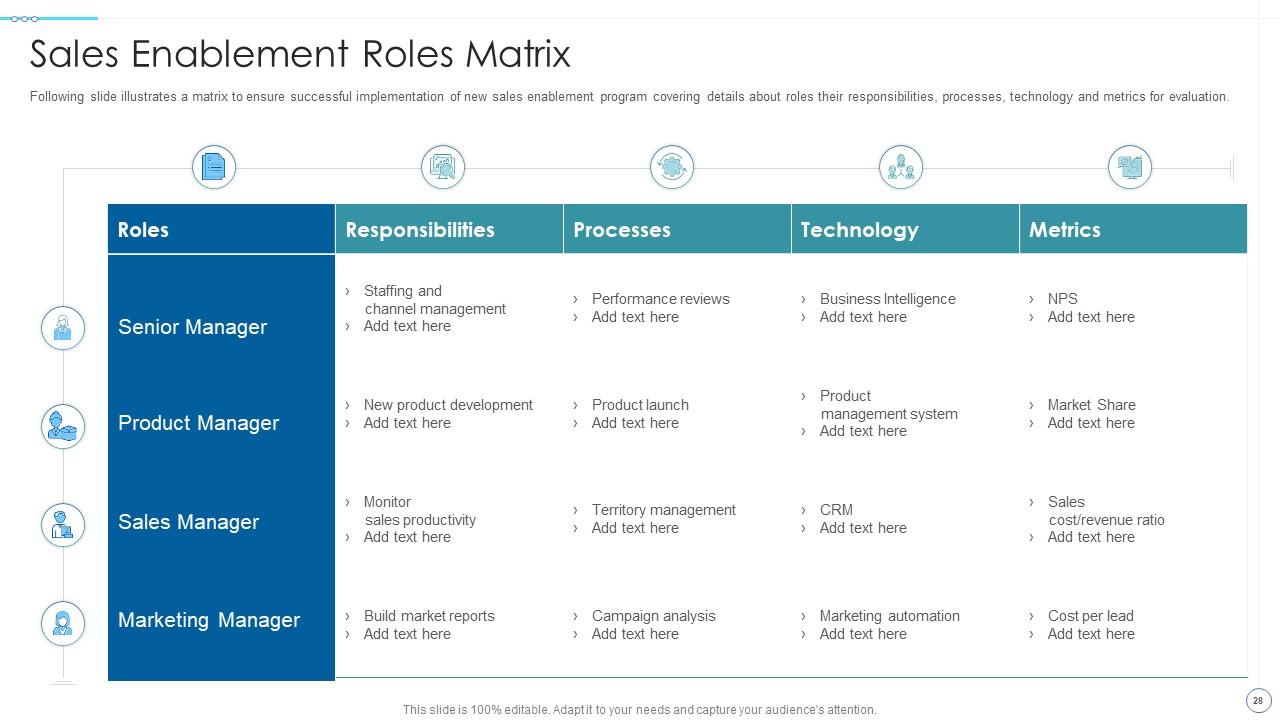
Slide 28: This slide illustrates a matrix to ensure successful implementation of new sales enablement program.
Slide 29: This slide exhibits title for technology buying cycle.
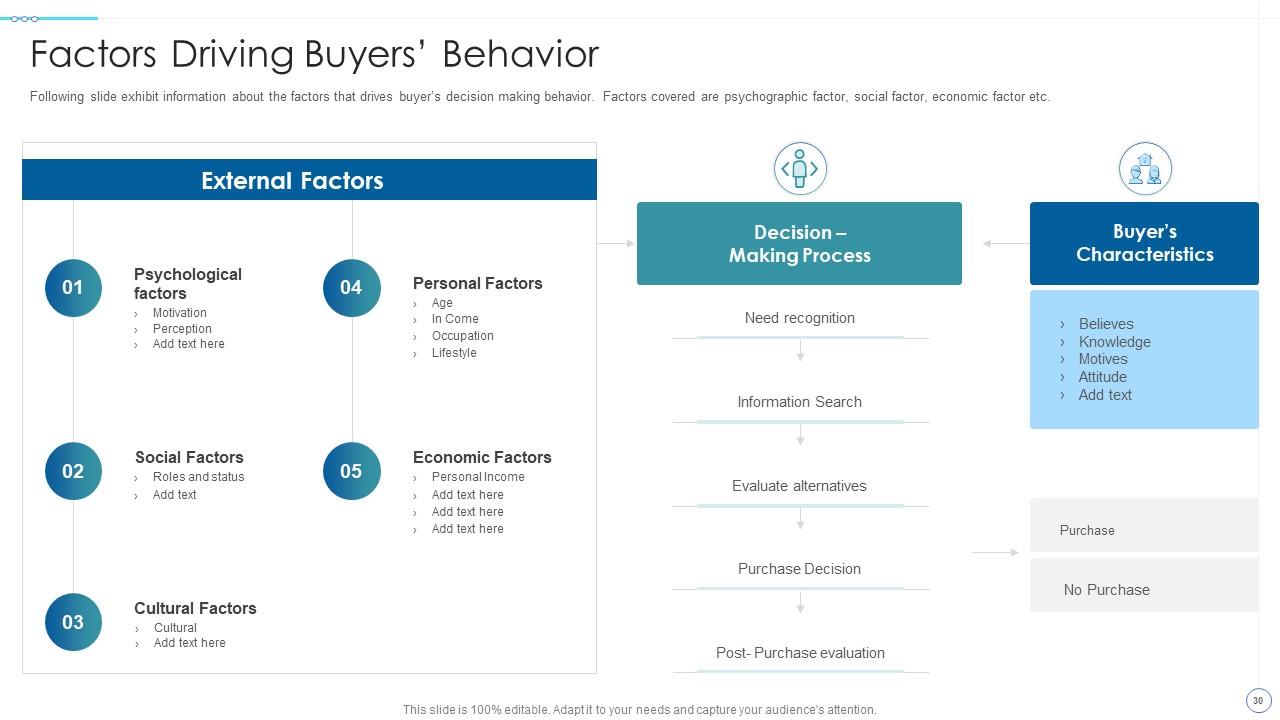
Slide 30: This slide displays factors that drives buyer’s decision making behavior.
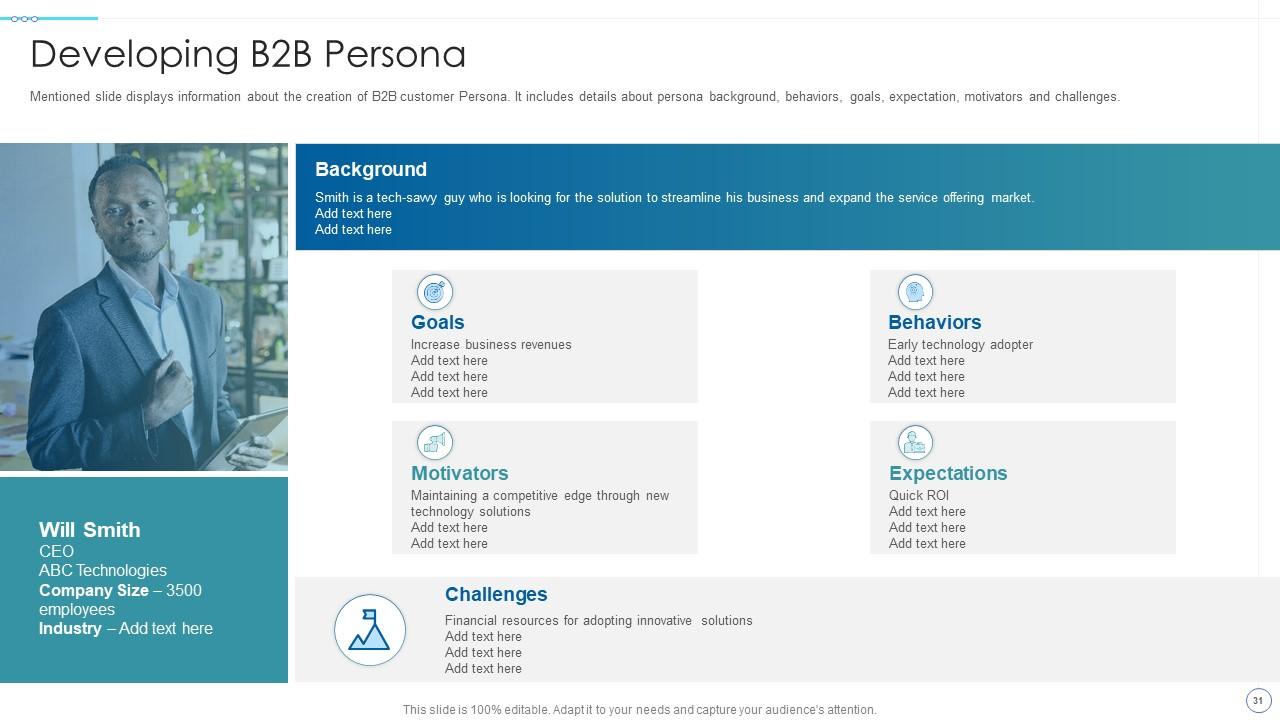
Slide 31: This slide presents creation of B2B customer Persona.
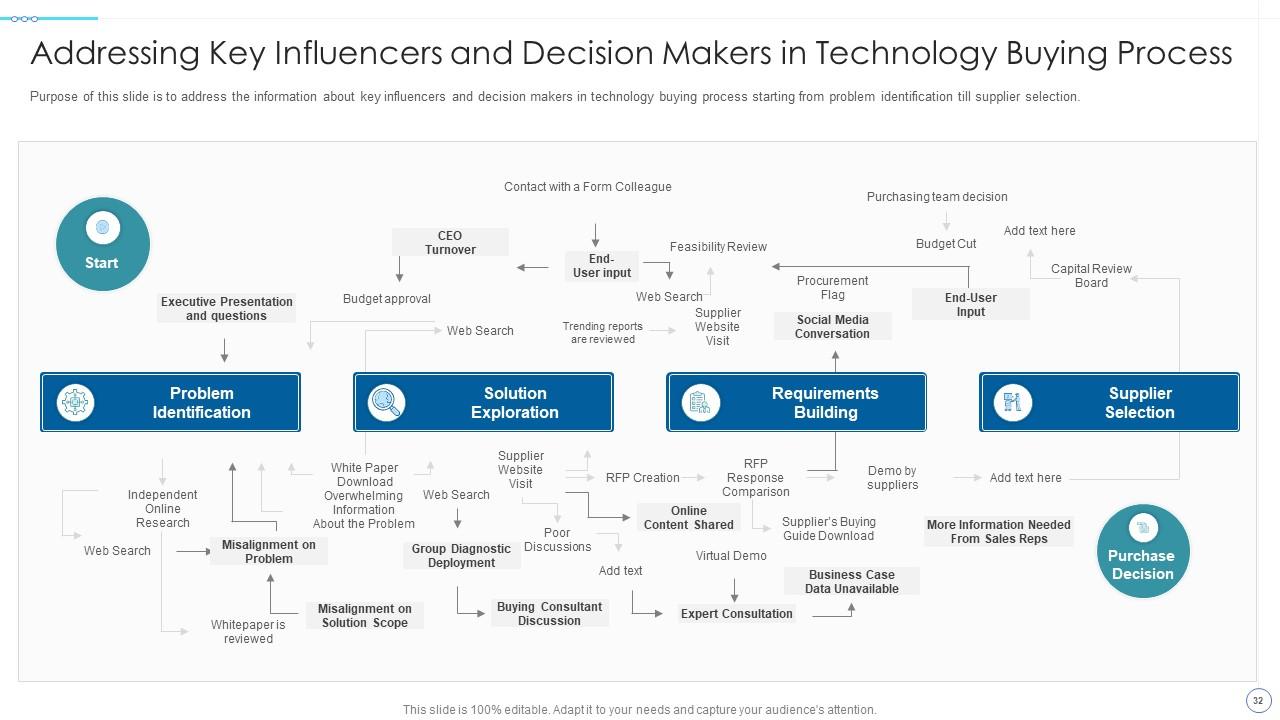
Slide 32: This slide address the information about key influencers and decision makers in technology buying process.
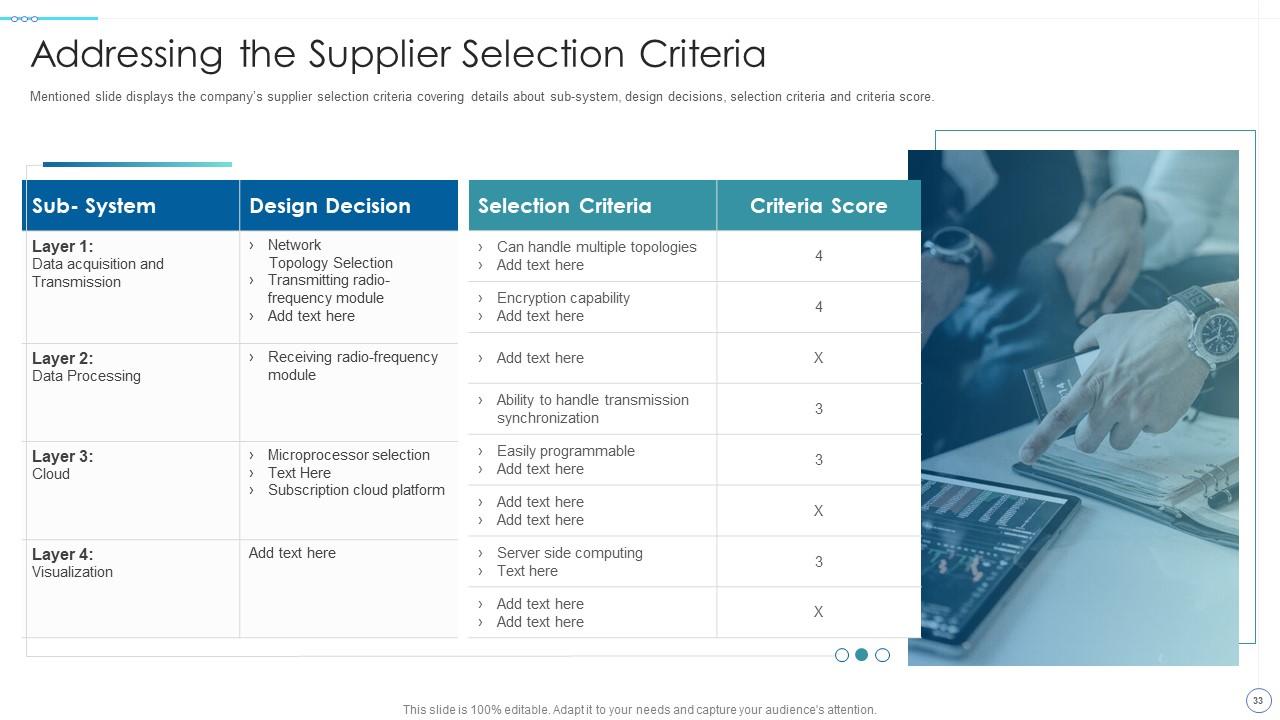
Slide 33: This slide shows company’s supplier selection criteria covering details about sub-system, design decisions, etc.
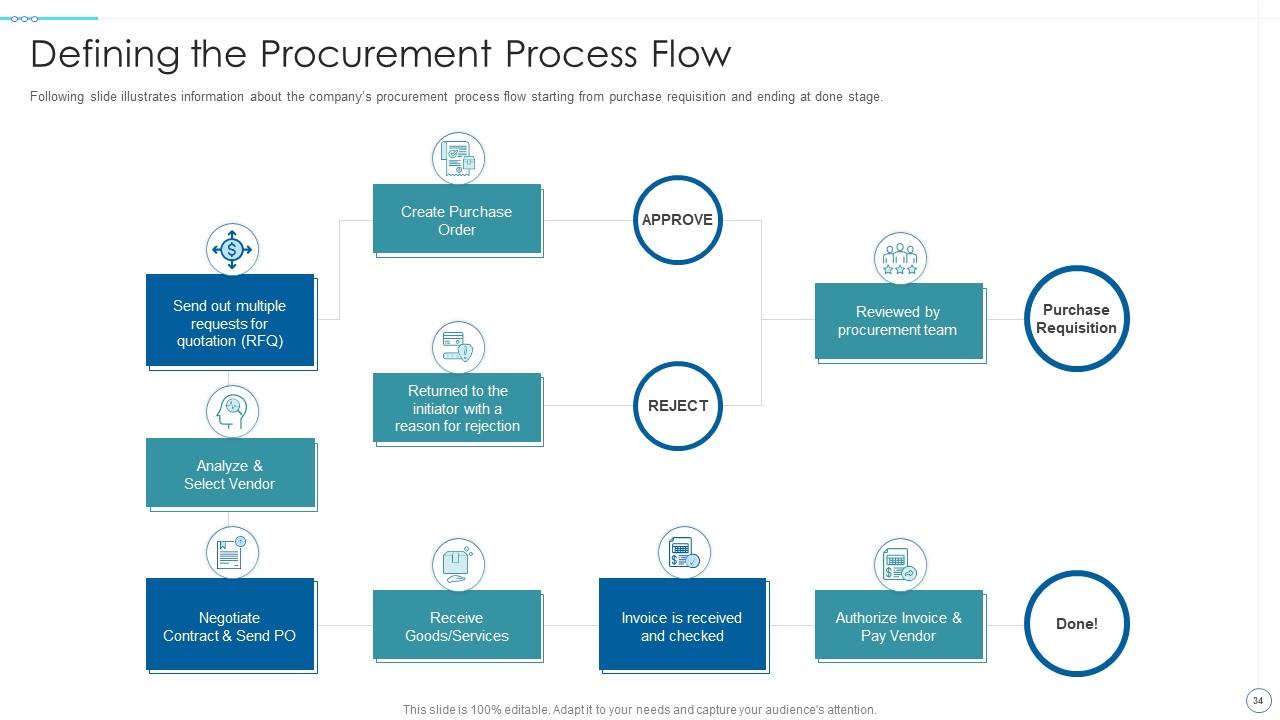
Slide 34: This slide exhibits company’s procurement process flow starting from purchase requisition and ending at done stage.
Slide 35: This slide highlights title for buyer journey.
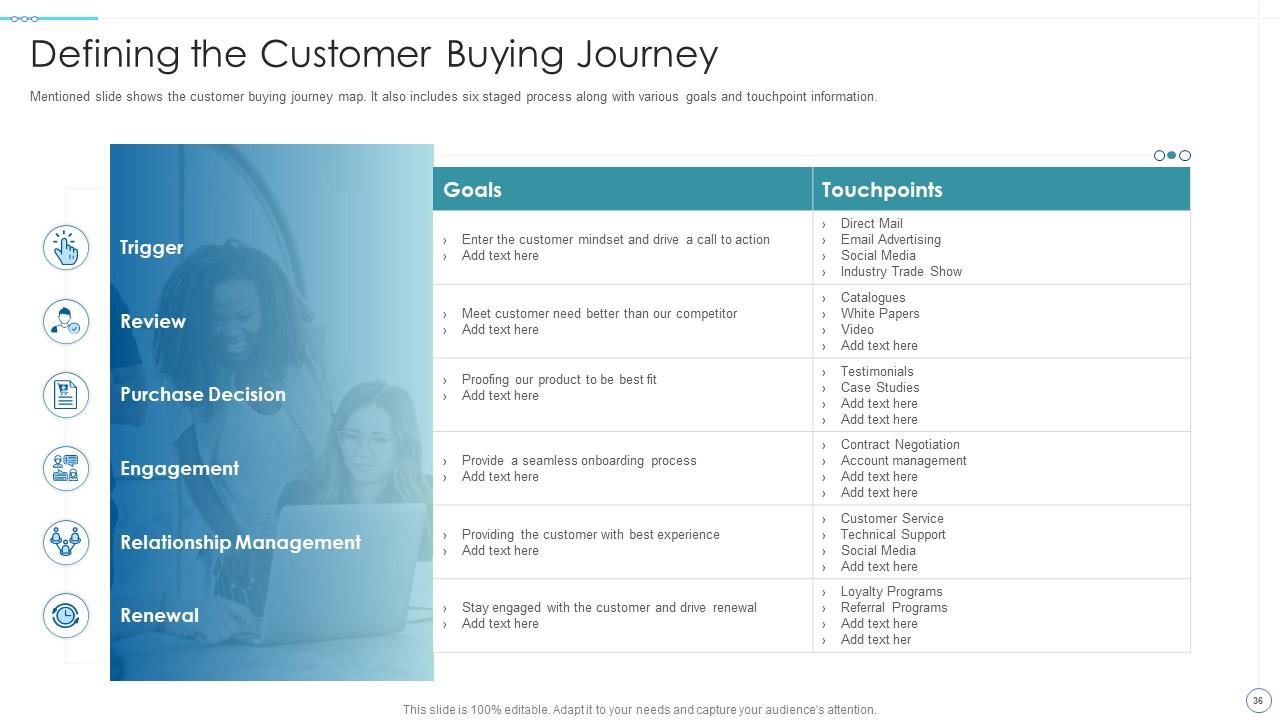
Slide 36: This slide shows the customer buying journey map.
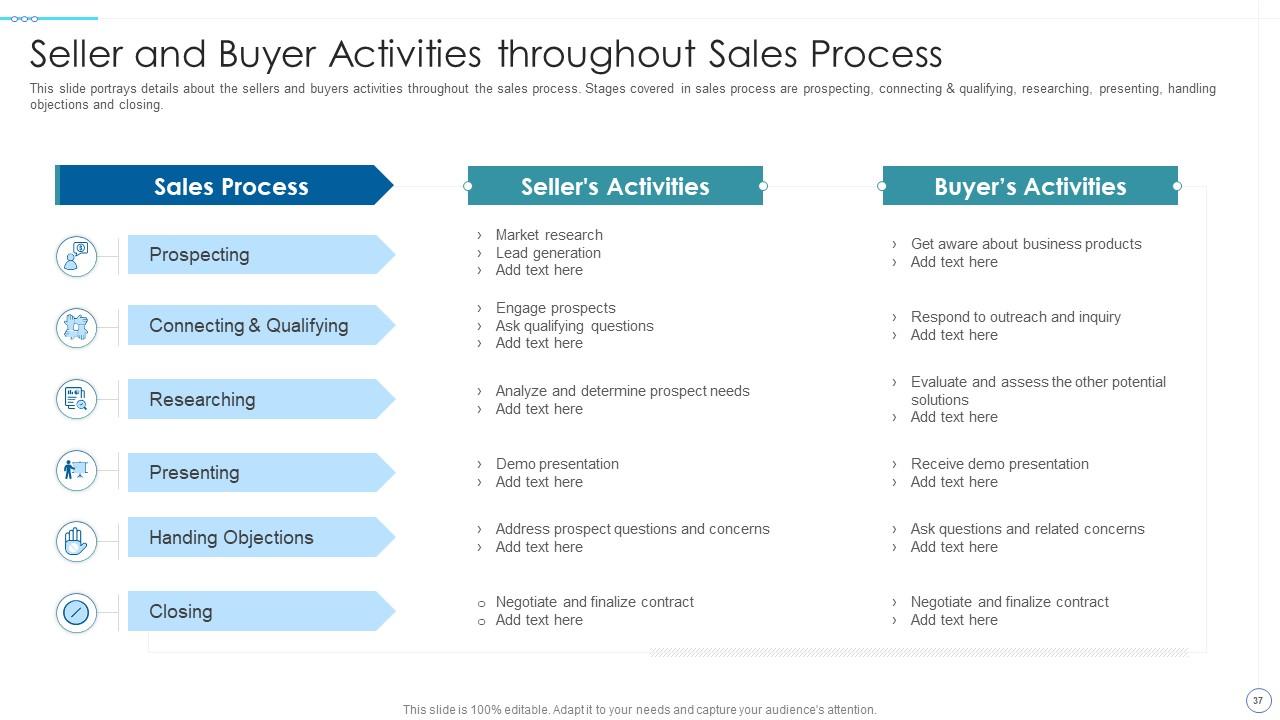
Slide 37: This slide portrays details about the sellers and buyers activities throughout the sales process.
Slide 38: This slide displays title for go-to-market plan.
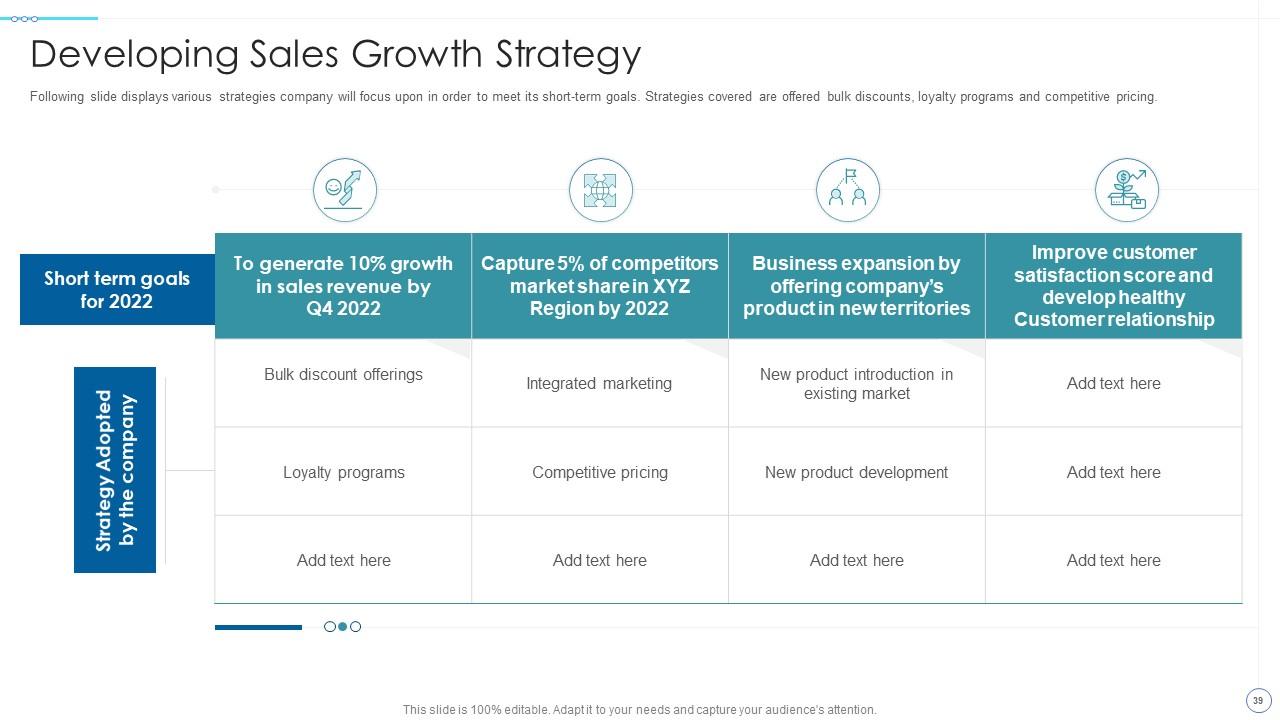
Slide 39: This slide presents various strategies company will focus upon in order to meet its short-term goals.
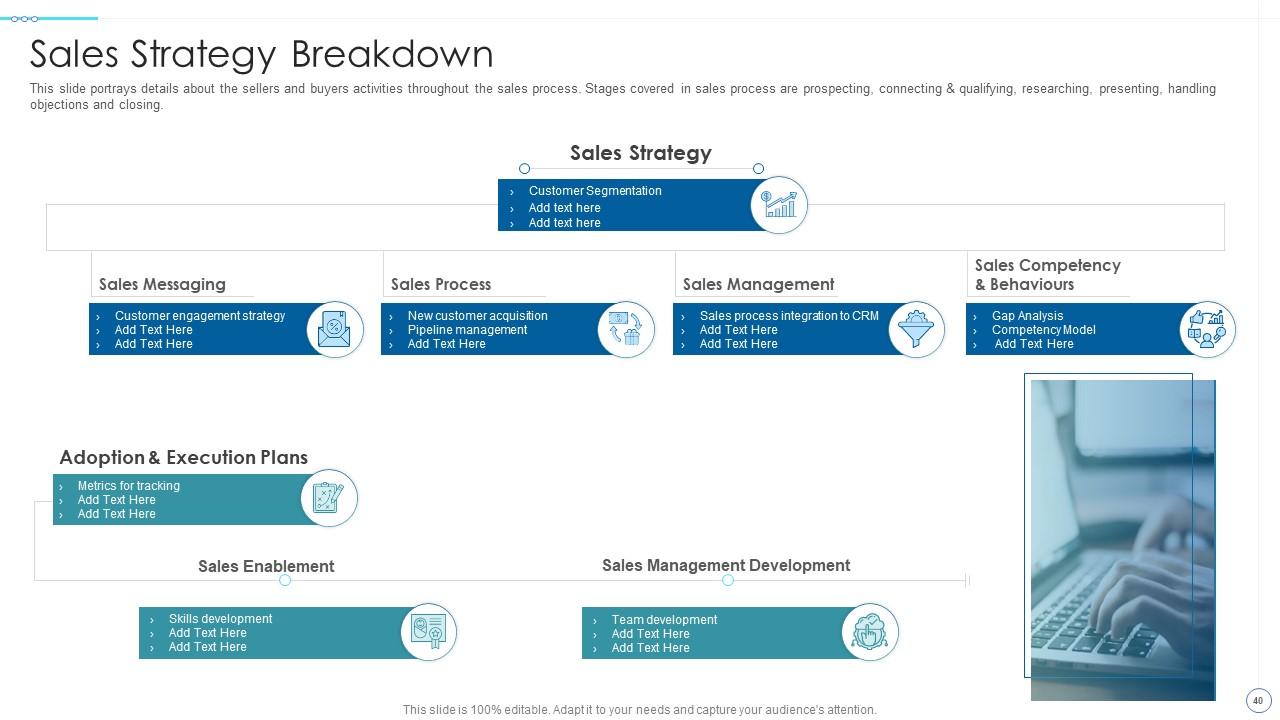
Slide 40: This slide portrays details about the sellers and buyers activities throughout the sales process.
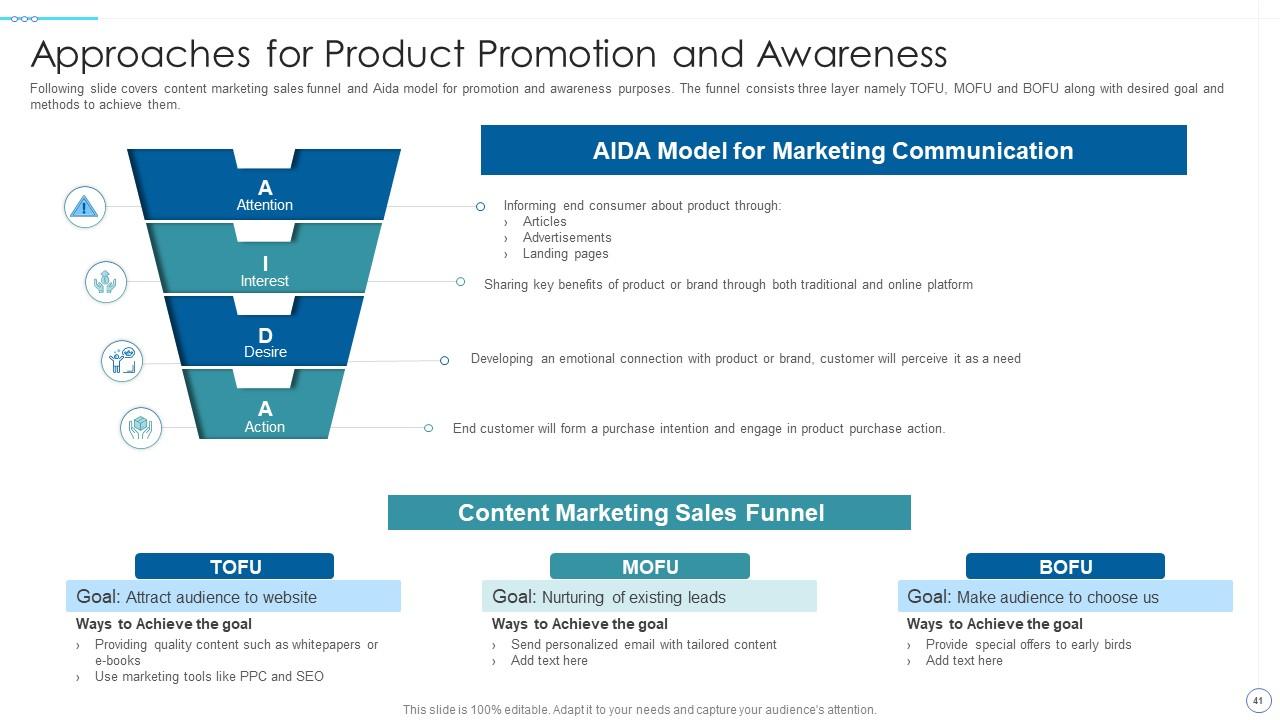
Slide 41: This slide covers content marketing sales funnel and Aida model for promotion and awareness purposes.
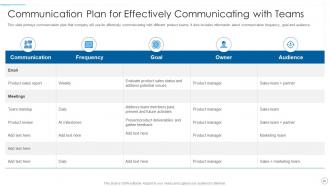
Slide 42: This slide portrays communication plan that company will use for effectively communicating with different product teams.
Slide 43: This slide shows title for measuring the success of marketing & sales efforts.
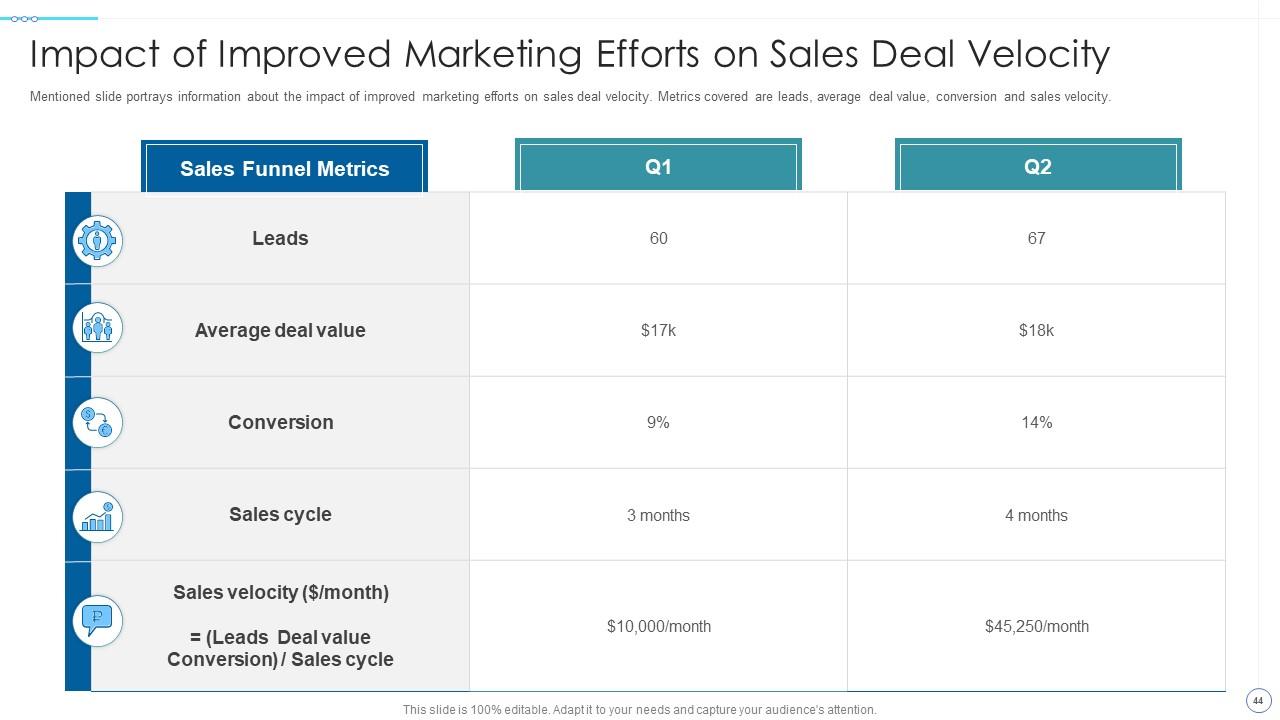
Slide 44: This slide portrays information about the impact of improved marketing efforts on sales deal velocity.
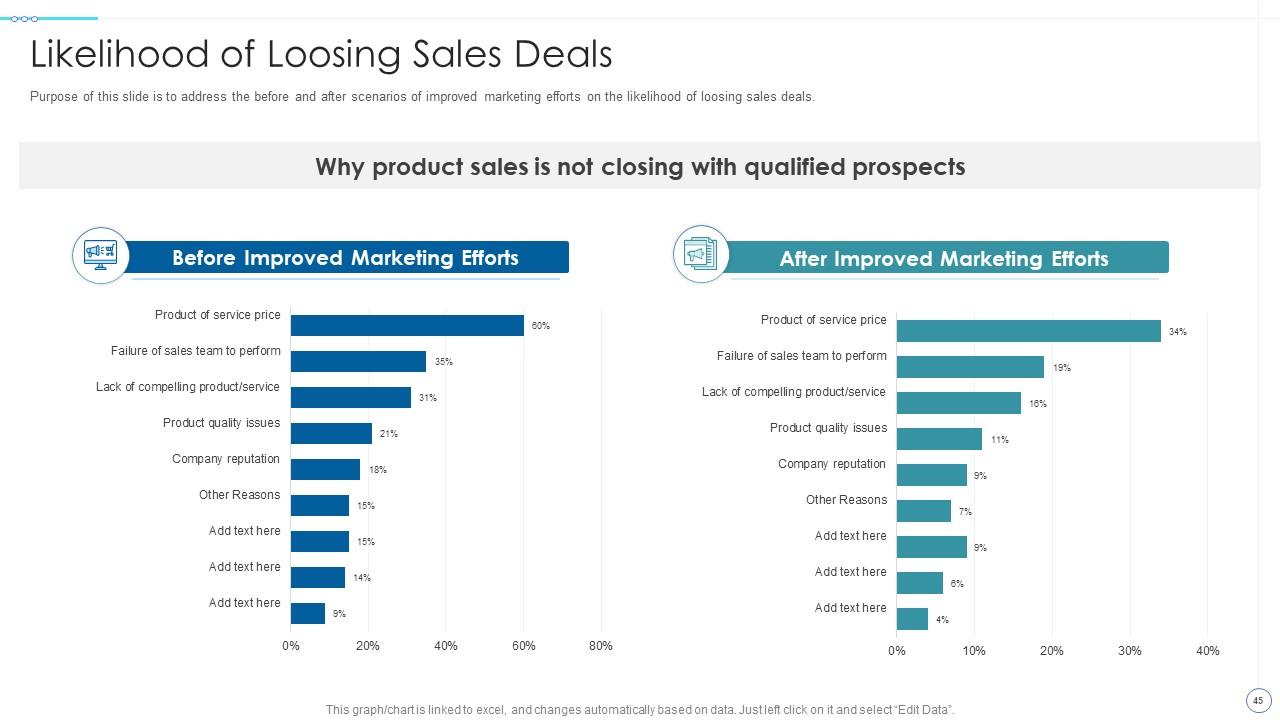
Slide 45: This slide address the before and after scenarios of improved marketing efforts on the likelihood of loosing sales deals.
Slide 46: This slide presents title for Performance Tracking Dashboards.
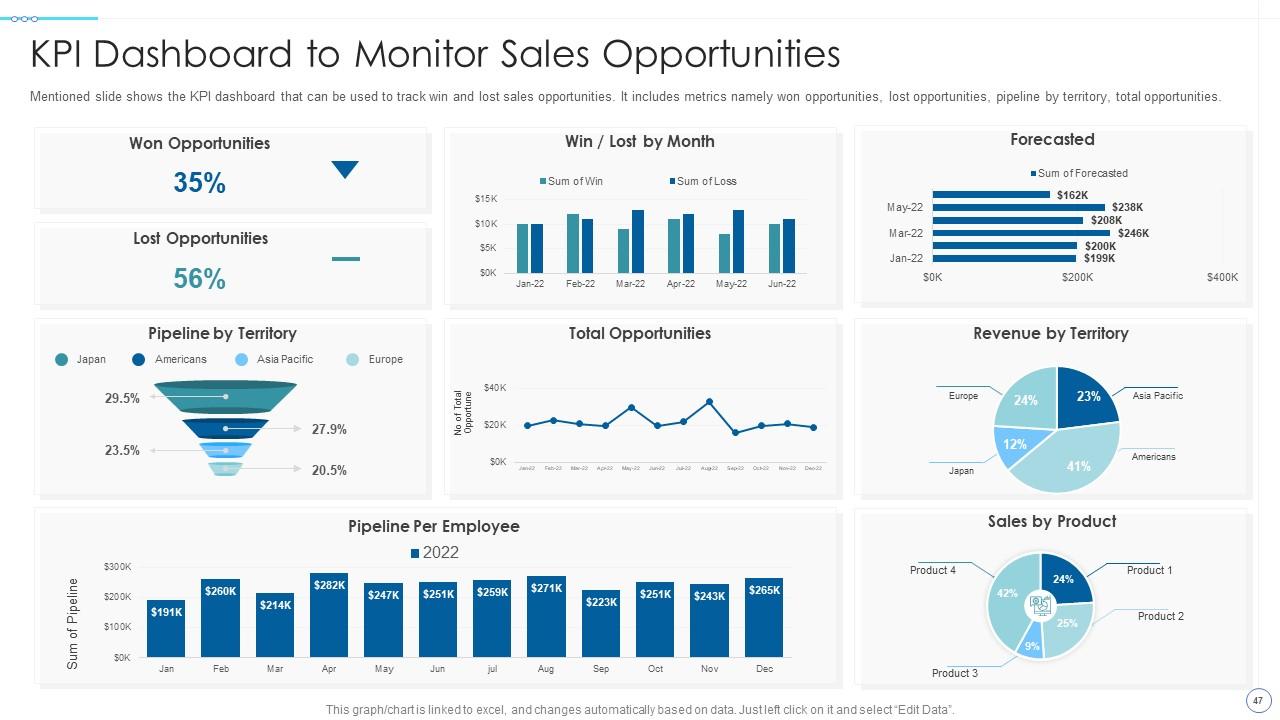
Slide 47: This slide shows the KPI dashboard that can be used to track win and lost sales opportunities.
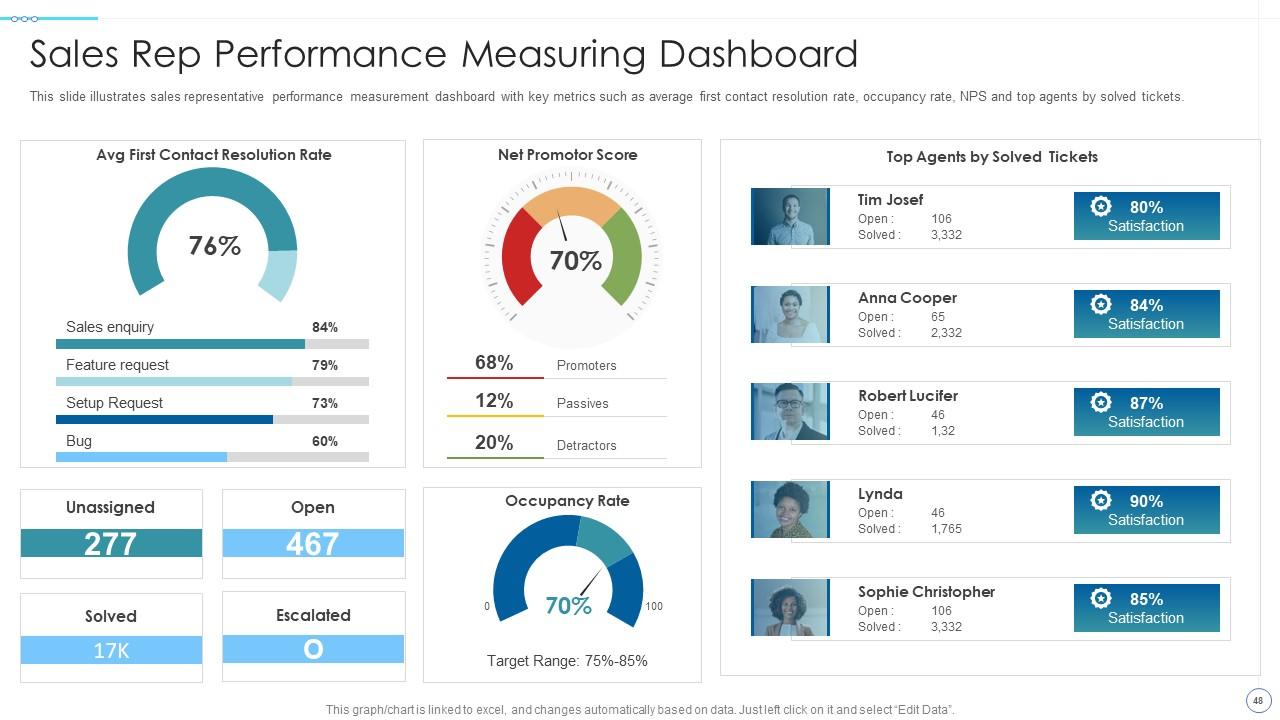
Slide 48: This slide illustrates sales representative performance measurement dashboard with key metrics.
Slide 49: This slide displays Icons for Understanding Market Dynamics to Influence Buyer Purchasing Decisions.
Slide 50: This slide is titled as Additional Slides for moving forward.
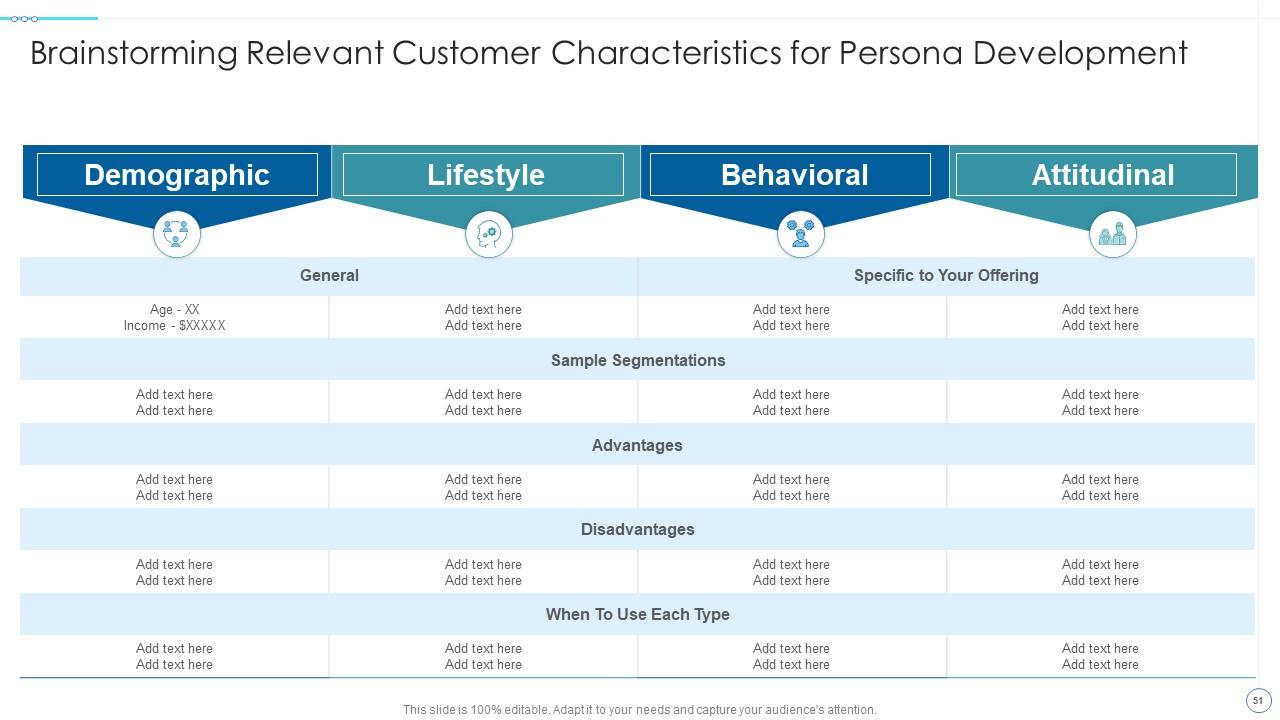
Slide 51: This slide represents Brainstorming Relevant Customer Characteristics for Persona Development.
Slide 52: This is Our Mission slide with related imagery and text.
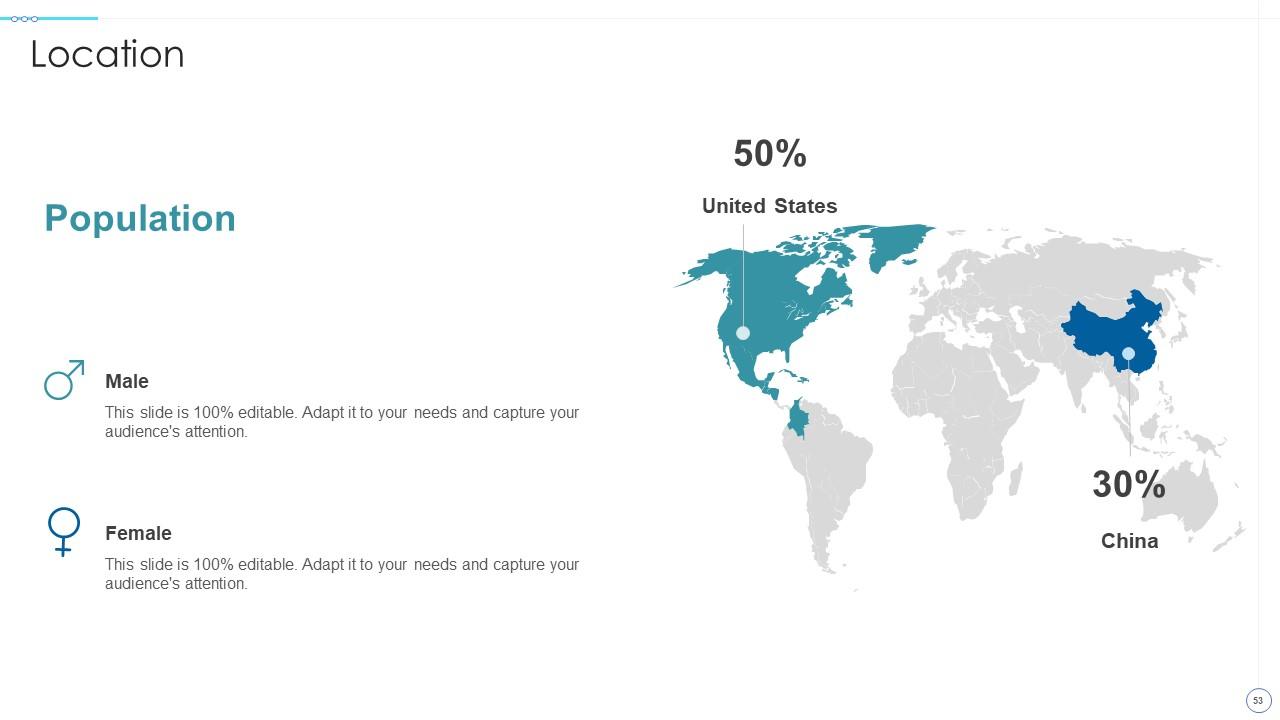
Slide 53: This is a Location slide with maps to show data related with different locations.
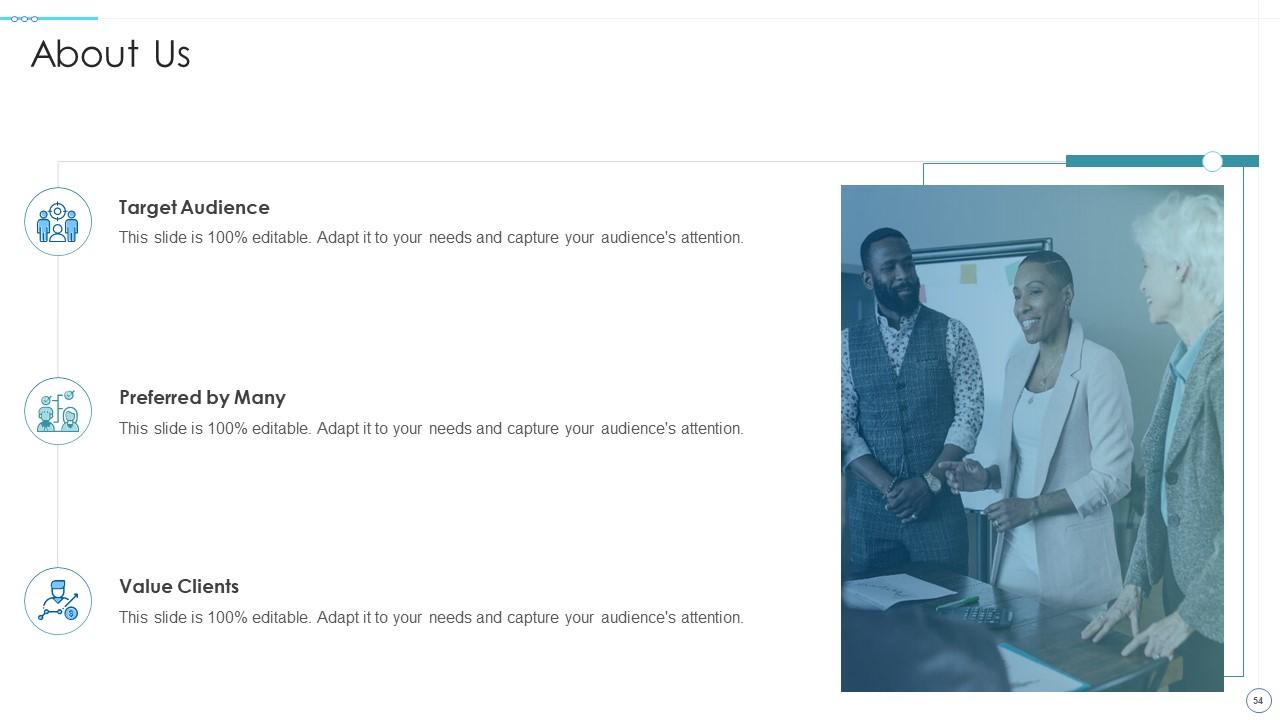
Slide 54: This is Our Target slide. State your targets here.
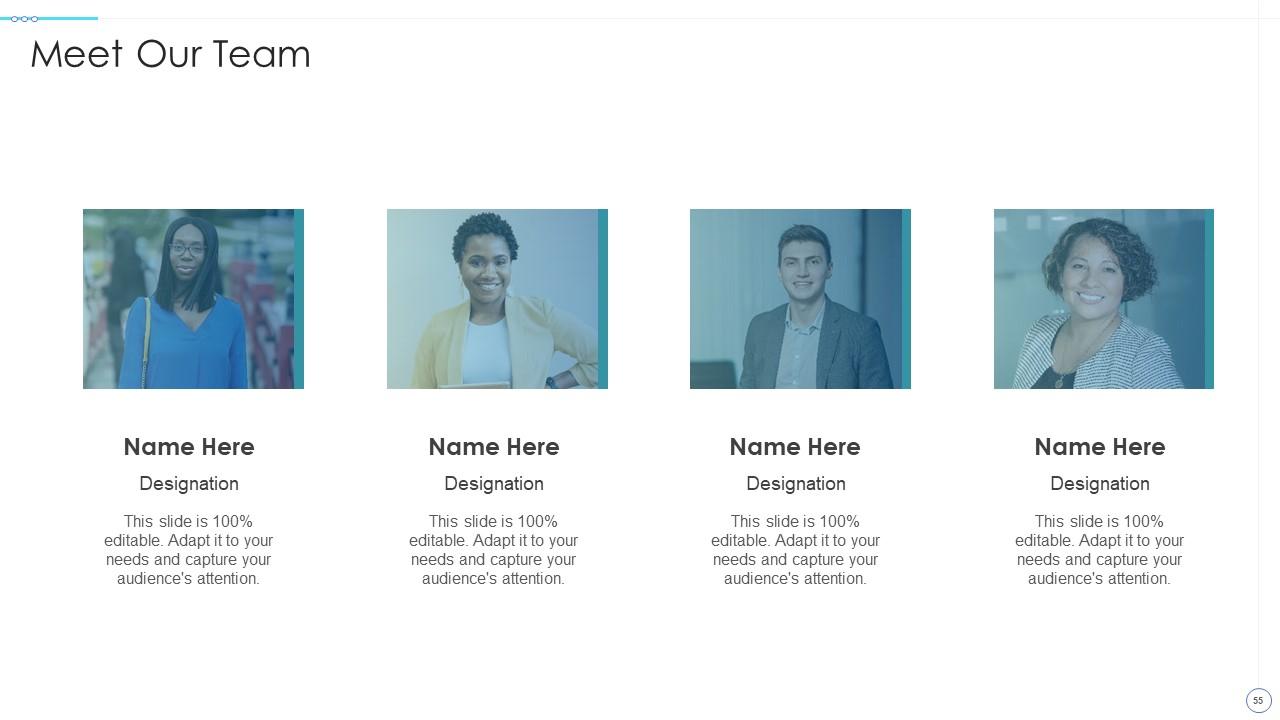
Slide 55: This is Our Team slide with names and designation.
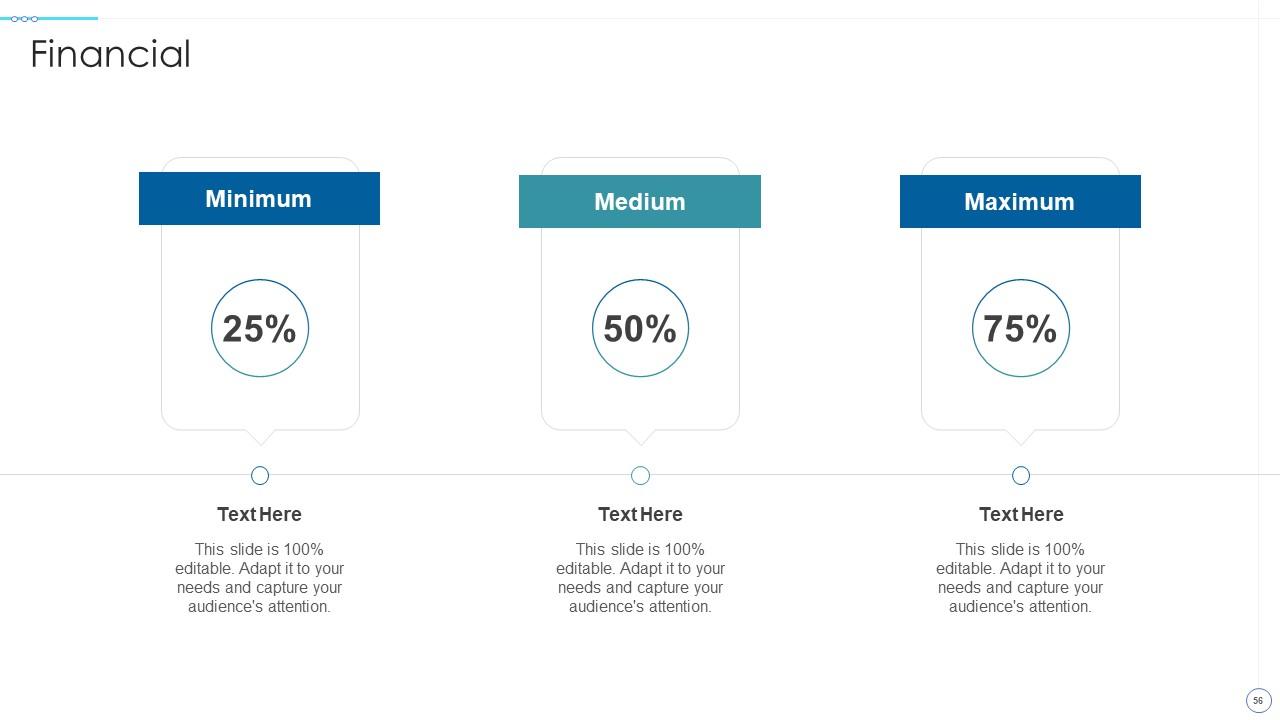
Slide 56: This is a Financial slide. Show your finance related stuff here.
Slide 57: This slide provides 30 60 90 Days Plan with text boxes.
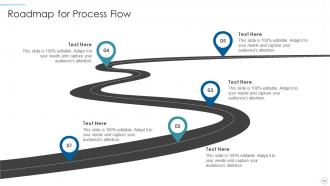
Slide 58: This slide represents Roadmap for Process Flow.
Slide 59: This slide shows Post It Notes. Post your important notes here.
Slide 60: This is Our Goal slide. State your firm's goals here.
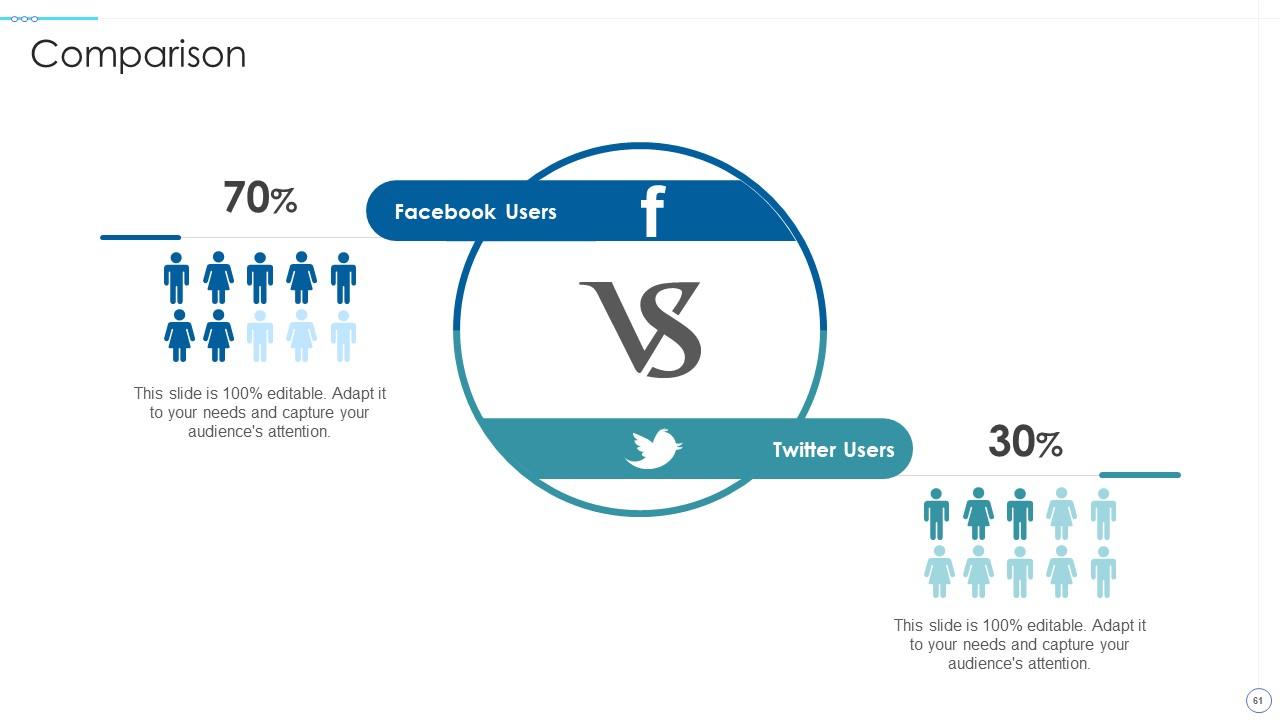
Slide 61: This is a Comparison slide to state comparison between commodities, entities etc.
Slide 62: This is a Thank You slide with address, contact numbers and email address.
Understanding market dynamics to influence buyer purchasing decisions complete deck with all 67 slides:
Use our Understanding Market Dynamics To Influence Buyer Purchasing Decisions Complete Deck to effectively help you save your valuable time. They are readymade to fit into any presentation structure.
-
Awesome use of colors and designs in product templates.
-
Commendable slides with attractive designs. Extremely pleased with the fact that they are easy to modify. Great work!


