

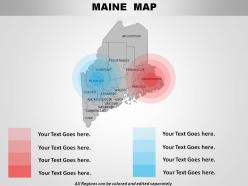
Usa maine state powerpoint maps





Try Before you Buy Download Free Sample Product
 Impress Your
Audience
 100%
Editable
 Save Hours
of Time


Your great ideas need some data. Feed them with our USA Maine State Powerpoint Maps.
People who downloaded this PowerPoint presentation also viewed the following :
Usa maine state powerpoint maps with all 28 slides:
Even the best ideas need to be presented well to succeed. Choose from thousands of USA Maine State Powerpoint Maps to put yours in the best possible light.




FAQs for Usa maine
Maine State PowerPoint maps include detailed county boundaries, major cities, geographical landmarks, customizable color schemes, and editable text placeholders. These features enhance presentations by enabling clear regional analysis, strategic planning visualization, and audience engagement through localized content, with many organizations finding that geographic specificity significantly improves stakeholder understanding and decision-making processes.
Educators can utilize Maine State PowerPoint maps by incorporating interactive visual elements, highlighting geographical features, demographic data, economic regions, and historical landmarks during lessons. These customizable maps enhance student engagement through clickable county details, population statistics, and resource distributions, while enabling teachers to create comprehensive geography curricula that connect Maine's physical features to real-world applications, ultimately delivering more dynamic learning experiences.
Maine State PowerPoint maps effectively display demographic data, economic indicators, regional sales performance, population density, educational statistics, and healthcare metrics through color-coding, heat mapping, and regional segmentation. These visualizations enable businesses, government agencies, and educational institutions to present county-level comparisons, market penetration analysis, and resource allocation patterns, ultimately delivering clearer insights for strategic planning and stakeholder presentations.
Maine State PowerPoint maps enhance business presentations by providing geographic context, visual data representation, regional market analysis, and location-based storytelling that resonates with audiences. These maps enable companies to showcase market penetration, distribution networks, and regional performance metrics effectively, while delivering clearer communication and strategic insights that ultimately strengthen stakeholder engagement and decision-making processes.
Best practices for customizing Maine State PowerPoint maps include identifying audience demographics, highlighting relevant geographic regions, adjusting color schemes for brand consistency, incorporating audience-specific data overlays, and selecting appropriate detail levels for presentation context. These customization strategies enhance audience engagement by streamlining information delivery, emphasizing pertinent locations, and creating visual cohesion, with many organizations finding that targeted map presentations deliver significantly improved comprehension and strategic decision-making outcomes.
Maine State PowerPoint maps enhance geographic information delivery through interactive elements, customizable data layers, dynamic zoom capabilities, and integrated multimedia content, while traditional displays offer static visual reference. Through digital formatting, these presentation maps enable real-time data updates, audience engagement features, and seamless integration with business analytics, with many organizations finding that interactive maps deliver significantly improved comprehension and strategic decision-making outcomes.
**INPUT**: What resources are available for sourcing accurate Maine State PowerPoint maps? **OUTPUT**: Resources for accurate Maine State PowerPoint maps include specialized presentation platforms like SlideTeam, government mapping databases, professional design services, educational institutions, and commercial map providers. These sources deliver comprehensive geographic data, customizable formats, and detailed county boundaries, with many organizations finding that professional presentation platforms streamline map integration while ensuring accuracy and visual consistency. [Word count: 54 words]
Common mistakes include using overly complex maps with excessive detail, poor color contrast that reduces readability, inconsistent scaling across slides, outdated geographic data, and failing to highlight relevant regions for your audience. These presentation pitfalls can be avoided by selecting clean, focused map designs, maintaining visual consistency throughout your deck, and ensuring geographic accuracy, ultimately delivering clearer communication and stronger audience engagement in business or educational settings.
Maine State PowerPoint maps enhance visual storytelling by providing geographic context, highlighting regional data patterns, showcasing location-specific initiatives, and creating memorable spatial narratives that resonate with audiences. These visual tools enable presenters to transform abstract data into compelling geographic stories, with organizations across healthcare, tourism, and economic development finding that location-based visuals significantly improve audience engagement and message retention.
Maine State PowerPoint maps can be interactive through clickable regions, hover effects, animated data overlays, hyperlinked hotspots, and embedded multimedia content. These interactive elements enhance audience engagement by enabling real-time exploration of regional data, with many businesses and educational institutions finding that clickable county demographics, economic indicators, and geographic features significantly improve presentation effectiveness and audience retention.
Maine's PowerPoint maps can showcase iconic landmarks including Acadia National Park, Portland Head Light, Old Orchard Beach, Bar Harbor, and the historic Kennebunkport area. These visual presentations enable tourism boards, educational institutions, and cultural organizations to highlight Maine's maritime heritage, natural beauty, and coastal attractions, ultimately enhancing visitor engagement and promotional effectiveness.
Maine State PowerPoint maps enhance real estate presentations by visualizing property locations, market territories, demographic distributions, zoning classifications, and regional development patterns across counties and municipalities. These maps enable realtors, developers, and investors to showcase market opportunities, highlight geographic advantages, and demonstrate area growth potential to clients, while streamlining complex location data into compelling visual narratives that ultimately accelerate decision-making processes.
PowerPoint, Adobe Illustrator, Canva, and specialized mapping tools like Lucidchart offer comprehensive editing capabilities for Maine State maps, enabling customization of colors, text, borders, and data visualization elements. These platforms streamline the design process by providing intuitive interfaces and templates, with many organizations finding that PowerPoint's native editing tools deliver professional results while maintaining compatibility across business presentations.
Maine State PowerPoint maps integrate with analytical data through layered visualizations, color-coded regions, interactive charts, and data-driven storytelling elements that transform static geography into dynamic insights. These enhanced presentations enable businesses and organizations to showcase market penetration, demographic trends, and performance metrics across Maine's counties, with many finding that combining geographical context with quantitative analysis delivers significantly more persuasive and memorable stakeholder communications.
**INPUT**: What are the potential legal considerations when using Maine State PowerPoint maps in a commercial setting? **OUTPUT**: Legal considerations include copyright compliance, licensing requirements, trademark restrictions, data accuracy liability, and attribution obligations when incorporating Maine maps into commercial presentations. While many organizations successfully navigate these requirements through proper licensing and vendor partnerships, businesses increasingly find that working with reputable template providers streamlines compliance while delivering professional cartographic assets for client presentations and strategic planning initiatives. **Word count: 58 words**
-
Really like the color and design of the presentation.
-
Easily Understandable slides.