

Usa michigan state powerpoint maps





Try Before you Buy Download Free Sample Product
 Impress Your
Audience
 100%
Editable
 Save Hours
of Time


A presentation may last for only fifteen minutes but you probably know preparation probably took more than a few days. By using our USA Michigan State Powerpoint Maps you save yourself a lot of time and effort that could be used elsewhere.
People who downloaded this PowerPoint presentation also viewed the following :
Usa michigan state powerpoint maps with all 28 slides:
Even under pressure your presentations need to perform. Give them a short of confidence with flawless USA Michigan State Powerpoint Maps designs.
-

United States of America Map
-

United States of America Map
-

Michigan Map
-

Michigan Map
-

Michigan Map
-

Michigan Map
-

Michigan Map
-

Michigan Map
-

Michigan Map
-

Michigan Map
-

Michigan Map
-

Michigan Map
-

Michigan Map
-

Michigan Map
-

Michigan Map
-

Michigan Map
-

Michigan Map
-
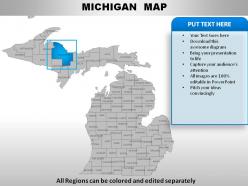
Michigan Map
-

Michigan Map
-

Michigan Map
-

Michigan Map
-

Michigan Map
-

Michigan Map
-

Michigan Map
-

Edit Color Inside the Group
-

Edit Color
-

Edit size
-

Insert names using text boxes
FAQs for Usa michigan
Michigan State PowerPoint maps feature accurate geographic boundaries, customizable colors and fonts, editable text boxes, scalable vector graphics, and professional design elements. These features enhance presentations by enabling clear regional data visualization, seamless brand integration, and engaging audience focus, with many organizations finding that location-specific visuals significantly improve comprehension and retention rates.
Michigan State PowerPoint maps enhance educational presentations by providing visual context for demographics, campus layouts, regional studies, economic data, and geographical references. These maps streamline complex information delivery while enabling students to better understand spatial relationships, state-specific case studies, and regional analysis, with many educators finding that visual mapping tools significantly improve comprehension and engagement in academic settings.
Best practices for customizing Michigan State PowerPoint maps include selecting appropriate color schemes that align with brand guidelines, highlighting relevant geographic regions or data points, incorporating clear legends and labels, ensuring readable font sizes, and maintaining visual consistency throughout the presentation. These customization techniques enhance audience comprehension by creating focused, professional visuals that support key business messages, with many organizations finding that strategic map customization significantly improves stakeholder engagement and decision-making outcomes.
Michigan State PowerPoint maps assist in visualizing geographical data trends by providing clear county-level breakdowns, demographic overlays, and regional pattern identification across the state's diverse territories. These maps enable businesses, researchers, and government agencies to analyze population distributions, economic indicators, and market penetration rates, while facilitating data-driven presentations that highlight regional opportunities, ultimately delivering enhanced strategic planning and more targeted resource allocation decisions.
Michigan State PowerPoint maps improve audience engagement by providing visual anchors, enabling interactive discussions, and making complex geographical data immediately comprehensible to viewers. These visual tools transform static presentations into dynamic experiences, with many presenters finding that location-specific maps encourage questions, facilitate better understanding of regional contexts, and ultimately deliver more memorable and impactful presentations.
Michigan State PowerPoint maps effectively represent demographic data, economic indicators, geographic distributions, sales territories, and electoral information across counties, districts, and regions. These visualizations enable businesses, educational institutions, and government agencies to showcase population trends, market penetration, resource allocation, and regional performance metrics, ultimately delivering clearer stakeholder communication and strategic insights.
Michigan State PowerPoint maps enhance local government decision-making by providing visual clarity for budget allocations, demographic analysis, infrastructure planning, and resource distribution across counties and municipalities. These geographic visualizations enable officials to identify trends, compare regional data, and communicate complex policy impacts effectively to constituents, ultimately streamlining strategic planning processes and building greater public support for municipal initiatives.
Microsoft PowerPoint is the primary software needed to edit Michigan State PowerPoint maps, offering comprehensive tools for customizing colors, text, shapes, and layouts directly within the presentation environment. Advanced users often combine PowerPoint with Adobe Illustrator or Photoshop for detailed graphic modifications, while built-in PowerPoint features like drawing tools, format painter, and animation effects enable most organizations to achieve professional customization without additional software investments.
Michigan State PowerPoint maps offer superior presentation integration compared to standalone mapping tools, delivering seamless embedding, consistent formatting, and immediate usability within slides. While traditional mapping software provides extensive geographic features, PowerPoint maps excel in business presentations by streamlining audience comprehension, enhancing visual storytelling, and enabling rapid customization, ultimately delivering more effective stakeholder communication and strategic clarity.
**INPUT**: What tips can be provided for integrating Michigan State PowerPoint maps with other visual aids? **OUTPUT**: Effective integration involves maintaining consistent color schemes, fonts, and design elements across all visuals, while strategically layering maps with charts, graphs, and infographics that complement geographic data. These approaches streamline presentations by creating visual hierarchy, ensuring seamless transitions between slides, and enhancing audience comprehension, with many organizations finding that coordinated visual storytelling ultimately delivers stronger stakeholder engagement and more persuasive business outcomes.
Michigan State PowerPoint maps enhance marketing and sales presentations by visualizing regional market penetration, customer distribution, territory assignments, and demographic targeting across Michigan's diverse regions. These maps enable sales teams to demonstrate geographic coverage, identify expansion opportunities, and present location-based data compellingly, with many organizations finding that visual territory representation significantly improves client engagement and strategic planning effectiveness.
Michigan State PowerPoint maps typically include population density, age distribution, income levels, education statistics, employment rates, and racial demographics by county or region. These demographic overlays enable businesses, government agencies, and researchers to identify market opportunities, allocate resources strategically, and develop targeted programs, with many organizations finding that visual demographic data enhances decision-making and presentation impact.
Visual elements in Michigan State PowerPoint maps enhance storytelling by creating geographic context, highlighting regional data patterns, and establishing emotional connections through familiar landmarks and boundaries. Through strategic color coding, interactive overlays, and detailed county distinctions, presenters can guide audiences through location-specific narratives, demonstrate market penetration across regions, and illustrate demographic trends, ultimately delivering more compelling and memorable presentations that resonate with Michigan-based stakeholders.
Michigan State PowerPoint maps benefit industries with significant Michigan operations, including automotive manufacturers, healthcare systems, logistics companies, real estate firms, and retail chains. These sectors leverage geographic visualization for market analysis, facility planning, and strategic expansion, with many organizations finding that location-based presentations enhance stakeholder understanding and accelerate decision-making processes.
Common mistakes include using outdated map data, overcrowding slides with excessive text or graphics, choosing poor color contrasts that reduce readability, failing to cite data sources, and selecting inappropriate map scales for the audience. These presentation pitfalls can significantly undermine your message's clarity and professional credibility, with many presenters finding that clean, well-sourced maps with strategic visual hierarchy ultimately deliver stronger audience engagement and more persuasive outcomes.
-
Thanks for all your great templates they have saved me lots of time and accelerate my presentations. Great product, keep them up!
-
Topic best represented with attractive design.