


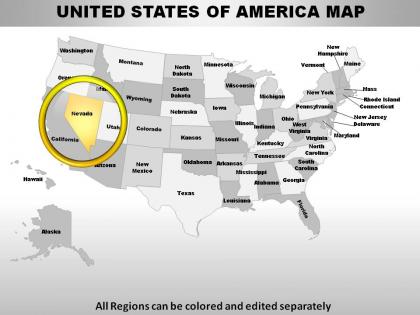
Usa nevada state powerpoint maps




Try Before you Buy Download Free Sample Product
 Impress Your
 Audience
 100%
100% Editable
 Save Hours
 of Time


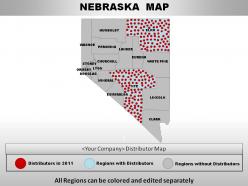
Take the plunge with our USA Nevada State Powerpoint Maps. They will bring the depth of your knowledge to the fore.
People who downloaded this PowerPoint presentation also viewed the following :
Usa nevada state powerpoint maps with all 28 slides:
Coffee, tea or our USA Nevada State Powerpoint Maps? We may be the choice you need.
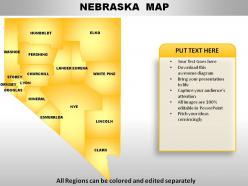
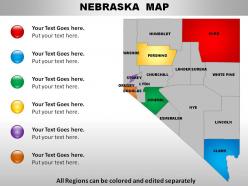
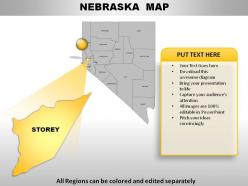
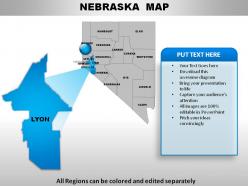
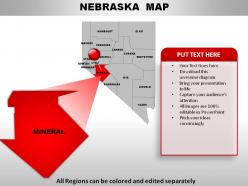
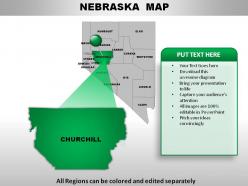
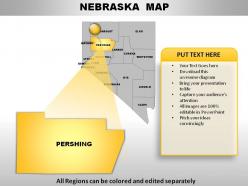
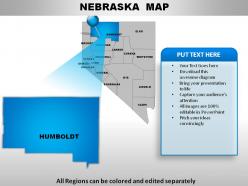
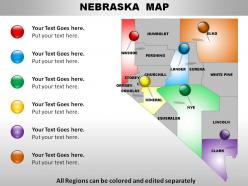
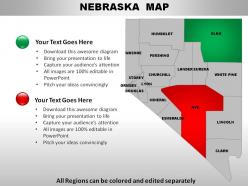
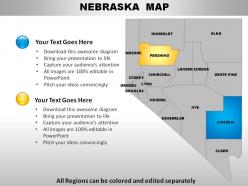
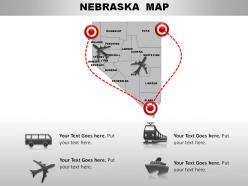
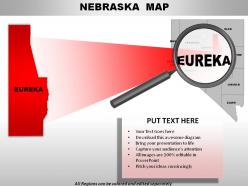
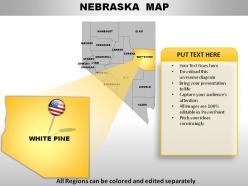
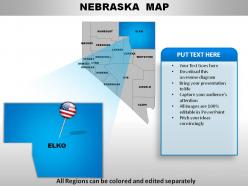
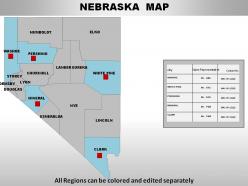


FAQs for Usa nevada
Nevada's current geographical boundaries were primarily shaped by the Compromise of 1850, which created the Utah Territory, the 1861 Nevada Territory establishment, and strategic Civil War-era statehood in 1864. These political decisions, combined with the 1866-1867 territorial expansions that transferred land from Utah and Arizona territories, ultimately delivered Nevada's distinctive rectangular shape, with many western states finding that such boundary negotiations balanced federal interests, regional politics, and resource access during rapid territorial development.
Nevada state maps illustrate landforms and elevations through topographic contour lines, color-coded elevation zones, shaded relief patterns, and geographic markers that highlight mountain ranges, valleys, and desert basins. These visual elements enable researchers, urban planners, and outdoor enthusiasts to identify elevation changes from the Sierra Nevada peaks to Death Valley lowlands, ultimately delivering comprehensive geographic understanding for navigation, development planning, and resource management across Nevada's diverse terrain.
Topographic maps of Nevada emphasize physical features like elevation changes, mountain ranges, valleys, and natural landmarks through contour lines and terrain symbols, while political maps focus on boundaries, cities, counties, and governmental jurisdictions. These complementary approaches serve different sectors, with topographic maps supporting outdoor recreation, mining operations, and environmental planning, while political maps facilitate administrative planning, electoral analysis, and demographic studies, ultimately delivering specialized geographic intelligence for diverse organizational needs.
State maps are essential for identifying Nevada's abundant mineral deposits, geological formations, water resources, geothermal areas, and mining districts across the state's diverse terrain. These detailed cartographic tools enable mining companies, government agencies, and resource planners to locate precious metals, lithium deposits, and energy sources, while supporting strategic resource extraction decisions, environmental planning, and economic development initiatives that leverage Nevada's position as a leading mineral-producing state.
Digital mapping technologies enhance Nevada state maps through GPS integration, satellite imagery, real-time data layers, interactive features, and mobile accessibility. These advanced systems enable researchers to analyze geological patterns, population trends, and resource distribution with precision, while travelers benefit from dynamic route optimization, weather overlays, and point-of-interest updates, ultimately delivering more comprehensive spatial intelligence.
Nevada state tourism maps commonly highlight major cities like Las Vegas and Reno, iconic landmarks including Lake Tahoe and Hoover Dam, national parks such as Great Basin, historic mining towns, and scenic byways. These features enable tourism operators to streamline visitor experiences by showcasing entertainment districts, outdoor recreation opportunities, and cultural attractions, ultimately delivering enhanced trip planning and increased visitor engagement across Nevada's diverse landscape.
Urban areas in Nevada appear as dense clusters with detailed street networks, landmarks, and infrastructure markings, while rural areas show sparse features with emphasis on natural terrain, highways, and geographic boundaries. These cartographic differences reflect population density and development patterns, with cities like Las Vegas and Reno requiring intricate detail for navigation, while Nevada's vast rural regions prioritize topographical features and major transportation corridors for travelers and land management purposes.
Geological mapping significantly enhances Nevada's environmental conservation by identifying sensitive ecosystems, groundwater resources, mineral deposits, and habitat corridors critical for wildlife protection. Through detailed subsurface analysis, conservationists can prioritize restoration areas, minimize mining impacts on fragile landscapes, and develop sustainable land management strategies, ultimately enabling more targeted resource allocation and long-term ecosystem preservation across Nevada's diverse terrain.
Nevada state maps reflect demographic changes through updated population density distributions, urban expansion patterns, age group concentrations, income level variations, and ethnic community clusters across different regions. These cartographic representations enable government agencies, businesses, and researchers to visualize shifting settlement patterns from rural to urban areas, ultimately delivering strategic insights for resource allocation, infrastructure planning, and targeted service delivery in Nevada's evolving communities.
Cartographers creating Nevada desert maps face challenges including sparse reference points, shifting sand dunes, extreme terrain variations, limited water sources, and vast empty spaces that complicate scale representation. These obstacles require specialized surveying techniques, satellite imagery integration, and frequent updates, with many mapping organizations finding that combining traditional methods with GPS technology ultimately delivers more accurate navigation tools for outdoor enthusiasts and emergency services.
Nevada state maps assist urban development planning by providing essential topographical data, land use classifications, population density analytics, infrastructure locations, and environmental constraints. Through detailed geographic information systems, planners can identify optimal development zones, assess utility accessibility, and evaluate transportation corridors, while ensuring compliance with zoning regulations, ultimately streamlining the approval process and minimizing costly development delays.
Historical maps of Nevada include the 1860s territorial surveys, railroad development charts from the 1870s-1880s, early highway system maps from the 1920s, and interstate planning documents from the 1950s-1960s. These cartographic resources enable researchers, urban planners, and transportation authorities to analyze network evolution, infrastructure investment patterns, and regional connectivity changes, ultimately delivering strategic insights for modern transportation planning and economic development initiatives.
Educators can use Nevada state maps to teach topographical features, county boundaries, historical mining regions, major cities like Las Vegas and Reno, and transportation routes. These visual tools enhance geography lessons by demonstrating desert landscapes, mountain ranges, and urban development patterns, while history classes benefit from exploring Gold Rush territories, railroad expansion, and population growth, ultimately delivering interactive learning experiences that improve student engagement and geographical literacy.
Nevada state maps have contributed to cultural preservation by documenting historic mining sites, Native American territories, pioneer trails, ghost towns, and archaeological locations across the state. These detailed cartographic records enable historians, researchers, and preservationists to track cultural landmarks over time, facilitate heritage tourism development, and support conservation efforts, with many museums and cultural institutions finding that comprehensive mapping helps secure funding for restoration projects while enhancing public awareness of Nevada's diverse historical legacy.
Comparing Nevada's maps with neighboring states reveals critical insights into resource distribution, transportation networks, economic corridors, and demographic patterns across the Southwest region. These comparative analyses enable businesses, government agencies, and researchers to identify cross-border opportunities, optimize supply chains, and understand regional development trends, ultimately delivering strategic advantages for expansion planning and resource allocation decisions.
-
Best way of representation of the topic.
-
Great designs, Easily Editable.