

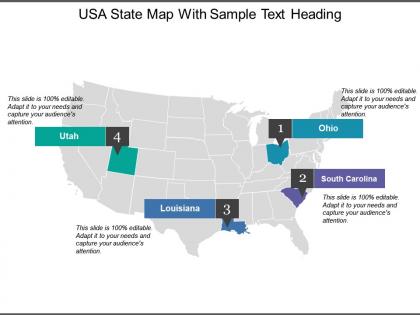
Usa state map with sample text heading





Try Before you Buy Download Free Sample Product
 Impress Your
 Audience
 100%
100% Editable
 Save Hours
 of Time


Equip folks to actualize dreams with our Usa State Map With Sample Text Heading. It helps concert aspirations into achievements.
People who downloaded this PowerPoint presentation also viewed the following :
Usa state map with sample text heading with all 5 slides:
Crank up the desire with our Usa State Map With Sample Text Heading. They are excellent appetizers.

FAQs for Usa state map with
**INPUT**: What are the key features of the USA state map that help in understanding geographical and political boundaries? **OUTPUT**: USA state maps include clearly defined state borders, capital city markers, major geographical features, interstate highways, and regional divisions that enhance territorial understanding. These visual elements streamline navigation, facilitate resource allocation planning, and enable strategic decision-making across sectors, with many organizations finding that detailed boundary information ultimately delivers improved logistics coordination and targeted market analysis.
Interactive USA state maps enhance learning by enabling visual exploration, hands-on engagement, and multi-sensory information retention through clickable regions, pop-up data displays, and customizable content layers. Educational institutions find these tools particularly effective for geography, history, and social studies curricula, with many teachers reporting improved student participation and comprehension when learners can actively explore demographic data, historical events, and economic information, ultimately delivering more engaging classroom experiences.
State maps serve as foundational tools for urban planning and infrastructure development by providing comprehensive geographic data, demographic patterns, transportation networks, zoning boundaries, and resource distribution across regions. These detailed visualizations enable planners to identify optimal locations for highways, utilities, and municipal services while coordinating cross-jurisdictional projects, ultimately streamlining development processes and enhancing strategic resource allocation for growing communities.
Demographic changes appear on USA state maps through shifting population densities, age distributions, ethnic compositions, and migration patterns between regions. These visual representations help policymakers, businesses, and researchers identify growth corridors, aging populations, and cultural diversity trends, ultimately enabling strategic resource allocation and targeted services across different states and metropolitan areas.
USA state maps enable businesses to visualize market penetration, identify expansion opportunities, analyze competitor presence, and optimize resource allocation across geographic regions. Through strategic mapping, companies streamline territory management, enhance sales planning, and target demographic clusters, with many retail chains and service providers finding that state-level visualization delivers clearer market insights and competitive positioning.
Variations in state map designs significantly affect regional perception through color schemes, typography choices, boundary emphasis, and data visualization techniques. Different design approaches can highlight economic strengths, downplay geographic challenges, or emphasize cultural distinctions, with many organizations finding that strategic map design influences audience understanding of regional opportunities, investment potential, and competitive landscapes across various states.
**INPUT**: What are the common projection techniques used in creating USA state maps? **OUTPUT**: Common projection techniques for USA state maps include Albers Equal Area Conic, Lambert Conformal Conic, Transverse Mercator, State Plane Coordinate System, and Web Mercator projections. These cartographic methods enhance geographic accuracy by minimizing distortion, preserving area relationships, and maintaining angular consistency, with mapping organizations, government agencies, and educational institutions finding that strategic projection selection ultimately delivers clearer spatial analysis and more effective geographic communication. **Word Count**: 60 words
Technology enhances state map accuracy through GPS surveying, satellite imaging, LiDAR scanning, GIS data integration, and real-time boundary verification systems. These digital mapping solutions streamline cartographic processes by eliminating manual errors, updating geographic changes automatically, and enabling precise territorial representations, with government agencies and urban planning organizations finding significantly improved accuracy for administrative decisions.
Historical landmarks identifiable through USA state maps include national monuments, battlefields, presidential sites, colonial settlements, and heritage trails. These maps enable historians, educators, and travelers to locate significant sites like Civil War battlefields, founding father homes, and Native American heritage areas, ultimately delivering enhanced educational experiences and strategic tourism planning across diverse American landscapes.
Thematic maps of the USA serve analytical purposes including demographic analysis, economic assessment, resource distribution mapping, policy impact evaluation, and market research planning. Through specialized data visualization, organizations can identify regional patterns, optimize resource allocation, and develop targeted strategies, with businesses, government agencies, and researchers finding that location-based insights drive more informed decision-making and competitive positioning.
Creating visually appealing USA state maps involves clear color coding, consistent typography, strategic use of white space, appropriate scale selection, and intuitive legend placement. These design elements enhance data comprehension by highlighting regional patterns, maintaining visual hierarchy, and ensuring accessibility across different viewing formats, with many organizations finding that well-designed state maps significantly improve stakeholder engagement and decision-making processes.
Effectively incorporating a USA state map involves selecting relevant geographic data, highlighting key markets or regions, and using visual elements like color coding, markers, and overlays to emphasize business insights. These maps enhance presentations by showcasing regional performance, market expansion opportunities, and demographic distributions, with many organizations finding that geographic visualizations streamline complex data communication and strengthen strategic planning discussions.
Common misconceptions include Alaska and Hawaii's actual sizes and locations, Texas being the largest state, Florida's shape and geographic position, and the relative distances between states. These geographic misunderstandings often stem from map projections and scale distortions in traditional representations, with many educators finding that interactive digital maps help students better grasp true state proportions and spatial relationships.
Climate diversity significantly influences how USA state maps visually represent geographic, economic, and demographic patterns through color coding, regional groupings, and thematic overlays that highlight agricultural zones, population centers, and industrial distributions. This climatic variation enables businesses and organizations to strategically identify market opportunities, resource allocation patterns, and operational considerations across different regions, with many companies finding that climate-based mapping enhances their expansion planning and competitive positioning.
**INPUT**: What tools and resources are recommended for creating custom USA state maps? **OUTPUT**: Recommended tools include GIS software like ArcGIS and QGIS, design platforms like Adobe Illustrator and Canva, mapping services like Google Maps API, and specialized resources like MapChart and SlideTeam templates. These solutions streamline map creation by offering customizable templates, data integration capabilities, and professional formatting options, with many organizations finding that pre-designed presentation templates deliver faster results and consistent branding across business communications. [Word count: 60]
-
Innovative and attractive designs.
-
Easy to edit slides with easy to understand instructions.