

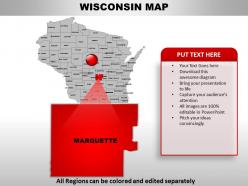
Usa wisconsin state powerpoint maps





Try Before you Buy Download Free Sample Product
 Impress Your
Audience
 100%
Editable
 Save Hours
of Time


If you are struggling to have an effective brain mapping tool or computer network topology mapping for the relief of a particular area or segment then all you need is to insert your thoughts or relevant information in the concerned PPT visual. Today even in the education industry teachers prefer to involve the students in any kind of activity so as to keep away the boredom from the studies thus an effective way to learn about geographical, wildlife or climatic variation of a particular country is by the use of presentation design. The PowerPoint map featuring USA Wisconsin state can be used not only to figure out locations in that particular state but also the location of surrounding areas can also be mapped in the same PowerPoint presentation. An effective way to have a 2 D view of surface of Earth or any part thereof can be made possible with the help of an impressive tool that is PPT graphic that compiles together information and graphic.Make sure your next presentation is memorable. Simple powerful designed Usa Wisconsin State Powerpoint Maps is the best way to help get your message through.
People who downloaded this PowerPoint presentation also viewed the following :
Usa wisconsin state powerpoint maps with all 29 slides:
Everyone is making demands on your time. Finish your presentation prep quickly with compelling Usa Wisconsin State Powerpoint Maps designs.




FAQs for Usa wisconsin
Wisconsin PowerPoint maps include detailed county boundaries, major cities, highways, geographical landmarks, and customizable color schemes for data visualization. These maps enhance presentations by enabling clear demographic analysis, sales territory planning, and regional performance tracking, with many organizations finding that visual geographical context significantly improves audience engagement and strategic decision-making effectiveness.
Wisconsin PowerPoint maps enable educators to teach geography through interactive visualizations, customizable regional overlays, population density demonstrations, and historical boundary comparisons. These digital tools streamline lesson planning by allowing teachers to highlight specific counties, cities, or geographic features, while students engage with dynamic content that enhances spatial understanding and retention of Wisconsin's diverse landscapes and demographics.
Wisconsin PowerPoint maps can represent demographic data, sales performance metrics, market penetration rates, regional customer distributions, and competitive analysis across different counties or cities. These visualizations enable businesses to showcase territory management, identify growth opportunities, track regional KPIs, and present location-based insights effectively, with many organizations finding that geographic data representation enhances strategic decision-making and stakeholder engagement.
Wisconsin PowerPoint maps can be customized through color coding for demographic data, layered information for regional analysis, interactive elements for audience engagement, and branded design elements for corporate presentations. These customization options enable presenters to tailor content for specific stakeholders, whether highlighting market territories for sales teams, showcasing service areas for healthcare organizations, or displaying economic data for government agencies, ultimately delivering more targeted and impactful presentations.
Tools that enhance Wisconsin PowerPoint map creation include advanced design software like Adobe Illustrator, specialized mapping platforms such as ArcGIS and Mapbox, data visualization tools like Tableau, and PowerPoint add-ins such as Think-Cell. These technologies streamline map development by offering precise geographic data integration, customizable styling options, and automated data visualization capabilities, with many presentation designers finding that combining multiple platforms delivers more engaging and accurate Wisconsin-focused visual content.
Common mistakes include using outdated county boundaries, selecting inappropriate color schemes that reduce readability, overcrowding maps with excessive data points, choosing incorrect map projections, and failing to provide clear legends or scale references. These errors can undermine presentation credibility and audience comprehension, with many Wisconsin-focused presentations finding that simplified, accurately sourced maps with strategic color choices ultimately deliver clearer insights and more professional outcomes.
Wisconsin PowerPoint maps typically offer comparable detail and usability to other state maps, featuring county boundaries, major cities, highways, and customizable elements for regional analysis. These maps excel in Midwest regional presentations, with many organizations finding that Wisconsin's distinctive shape and Great Lakes positioning make it particularly effective for manufacturing, agriculture, and logistics presentations, ultimately delivering clear geographical context and professional visual impact.
Industries like healthcare, manufacturing, logistics, real estate, and financial services benefit significantly from Wisconsin PowerPoint maps when presenting regional data, market analysis, or operational coverage. These visual tools enhance stakeholder presentations by clearly illustrating geographic distribution, service areas, and market penetration across Wisconsin's counties, ultimately delivering more compelling proposals and strategic insights.
**INPUT**: What are the best practices for integrating Wisconsin PowerPoint maps with other visual elements? **OUTPUT**: Best practices include maintaining consistent color schemes, using complementary fonts, aligning map elements with surrounding graphics, incorporating matching icons, and ensuring proper spacing ratios. These design principles streamline visual flow by creating cohesive presentations, enhancing data comprehension, and delivering professional aesthetics, with many organizations finding that strategic integration ultimately improves audience engagement and message clarity. *Word count: 56 words*
Presenters can effectively use color schemes on Wisconsin PowerPoint maps by employing contrasting colors for data differentiation, consistent palettes for brand alignment, and strategic highlighting for emphasis. Through thoughtful color selection, businesses streamline audience comprehension, enhance visual storytelling, and deliver impactful presentations, with many organizations finding that purposeful color coding significantly improves data interpretation and audience engagement.
Interactive Wisconsin PowerPoint maps engage remote viewers through clickable regions, hover-over data displays, animated transitions between counties or cities, and embedded multimedia content like videos or audio clips. These features transform static presentations into dynamic experiences, enabling presenters to highlight specific locations, demographic trends, or business opportunities across Wisconsin, while maintaining audience attention and facilitating better comprehension of geographic data.
**INPUT**: Which demographic information is most relevant to include in Wisconsin PowerPoint maps for market analysis? **OUTPUT**: Essential demographic data for Wisconsin market analysis includes population density, household income levels, age distribution, educational attainment, and employment sectors by region. These data points enable businesses to identify target markets, optimize retail locations, and tailor marketing strategies, with many companies finding that combining income and population density data delivers the most actionable insights for strategic planning. [Word count: 58 words]
Wisconsin PowerPoint maps enhance political data visualization by displaying election results through color-coded counties, district boundaries, demographic overlays, and voting pattern comparisons across multiple election cycles. These visual tools enable campaign managers, political analysts, and news organizations to identify swing districts, track voter turnout trends, and communicate complex electoral data clearly, ultimately delivering more compelling presentations and strategic insights for political decision-making.
Wisconsin PowerPoint maps serve as powerful visual anchors for tourism presentations, highlighting key attractions like Wisconsin Dells, Door County, and Lake Superior shores while providing geographic context for travel routes and regional destinations. These maps enable tourism boards, travel agencies, and hospitality businesses to create compelling narratives that guide visitors through the state's diverse offerings, ultimately enhancing marketing effectiveness and visitor engagement.
Legal considerations for using Wisconsin maps in commercial presentations include copyright compliance, data licensing requirements, attribution obligations, trademark restrictions, and accuracy standards. When sourcing maps from government databases, commercial providers, or creating custom versions, businesses must verify usage rights, provide proper credits, and ensure geographical precision, with many organizations finding that licensed professional map templates deliver both legal compliance and presentation quality.
-
Graphics are very appealing to eyes.
-
Awesome use of colors and designs in product templates.