

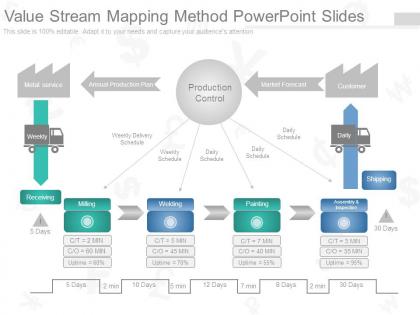
Value stream mapping method powerpoint slides




Try Before you Buy Download Free Sample Product
 Impress Your
 Audience
 100%
100% Editable
 Save Hours
 of Time


Create a client friendly atmosphere with our Value Stream Mapping Method Powerpoint Slides. They feel well disposed towards you.
People who downloaded this PowerPoint presentation also viewed the following :
Value stream mapping method powerpoint slides with all 7 slides:
Clue them in with our Value Stream Mapping Method Powerpoint Slides. Your audience will admire your analytical skills.


FAQs for Value stream mapping
Key components of a value stream map include process boxes, data boxes, inventory triangles, information flows, and timeline calculations. These elements work together by visualizing material flow, capturing cycle times and lead times, and identifying waste points, with many manufacturing and service organizations finding that comprehensive VSM components enable systematic process improvement and operational efficiency gains.
Value stream mapping identifies waste by visualizing every step in a process, revealing non-value-added activities like waiting times, excess inventory, overproduction, and redundant handoffs. Through detailed process analysis, organizations can pinpoint bottlenecks, eliminate inefficiencies, and streamline workflows, with many manufacturers and service providers finding significant cost reductions and improved customer delivery times.
Current state value stream maps document existing processes with actual cycle times, wait periods, inventory levels, and inefficiencies, while future state maps design optimized workflows with reduced waste, streamlined handoffs, and improved flow. Through strategic comparison, organizations in manufacturing, healthcare, and service industries identify specific improvement opportunities, eliminate bottlenecks, and ultimately deliver faster throughput and enhanced operational efficiency.
Determining scope for value stream mapping involves selecting a specific product family or service line, defining clear start and end points within the process, and identifying key stakeholders who impact flow. Organizations typically begin with high-impact processes that directly affect customer value, focusing on areas where waste reduction can deliver measurable improvements in lead times, quality, and operational efficiency.
Value stream mapping serves as a foundational tool in lean manufacturing by visualizing entire production processes, identifying waste, bottlenecks, and inefficiencies throughout the workflow. This strategic approach enables manufacturers to streamline operations, reduce lead times, and eliminate non-value-added activities, with automotive and electronics companies finding that systematic mapping ultimately delivers improved quality, lower costs, and enhanced competitive advantage.
Value stream mapping extends beyond manufacturing to healthcare, software development, financial services, and customer service operations by identifying inefficiencies, reducing wait times, and streamlining processes. These applications enable hospitals to accelerate patient flow, banks to expedite loan approvals, and tech companies to minimize development cycles, ultimately delivering enhanced customer experiences and operational efficiency across diverse organizational contexts.
**INPUT**: What software tools are recommended for creating value stream maps? **OUTPUT**: Recommended software tools for value stream mapping include Lucidchart, Visio, SmartDraw, Miro, and specialized platforms like ValueStreamGuru and eVSM. These tools streamline mapping by offering pre-built templates, collaborative features, and real-time editing capabilities, with many manufacturing and service organizations finding that digital platforms enhance accuracy, enable team collaboration, and ultimately deliver faster process improvements.
Teams can effectively collaborate on creating value stream maps by involving cross-functional stakeholders, conducting collaborative workshops with actual process participants, and using visual mapping tools that enable real-time input from multiple departments. Through structured facilitation and shared digital platforms, organizations streamline data collection, enhance process transparency, and ensure comprehensive mapping accuracy, with many teams finding that inclusive collaboration ultimately delivers more actionable insights and stronger buy-in for improvement initiatives.
Value stream mapping should track cycle time, lead time, process time, changeover time, uptime percentage, defect rates, and inventory levels at each process step. These metrics enable organizations to identify bottlenecks, reduce waste, and streamline operations, with many manufacturing and service companies finding that comprehensive measurement delivers significantly improved efficiency and customer satisfaction.
Value stream mapping contributes to improving customer satisfaction by identifying and eliminating bottlenecks, reducing lead times, and streamlining processes that directly impact service delivery. Through systematic analysis of workflows, organizations can minimize defects, accelerate order fulfillment, and enhance product quality, with manufacturing companies and service providers finding that optimized value streams ultimately deliver faster response times and more consistent customer experiences.
Common challenges include resistance to change from employees, difficulty gathering accurate data across departments, lack of leadership buy-in, and insufficient training on VSM methodologies. Organizations often struggle with cross-functional collaboration and maintaining momentum after initial mapping, with many manufacturing and service companies finding that dedicated facilitation and phased implementation approaches help overcome these obstacles while delivering sustainable process improvements.
Organizations should update their value stream maps quarterly or semi-annually, with immediate updates triggered by significant process changes, technology implementations, or performance issues. This regular cadence ensures maps remain accurate and actionable, with many manufacturing and service organizations finding that frequent updates enable continuous improvement initiatives, faster problem identification, and sustained operational efficiency gains.
Successful value stream mapping initiatives include Toyota's lean manufacturing optimization, Amazon's warehouse fulfillment streamlining, and healthcare systems reducing patient wait times through process visualization. These implementations enhance operational efficiency by identifying bottlenecks, eliminating waste, and improving resource allocation, with many organizations finding that mapping delivers faster cycle times, reduced costs, and enhanced customer experiences across manufacturing, logistics, and service sectors.
Value stream mapping integrates seamlessly with other lean practices by providing the foundational analysis for kaizen events, 5S implementation, kanban system design, and standardized work procedures. Through this strategic combination, manufacturing companies and service organizations streamline operations, reduce waste by 20-40%, and enhance overall efficiency, with many finding that integrated lean approaches deliver sustained competitive advantage.
Effective value stream mapping facilitation requires process analysis skills, lean methodology knowledge, workshop facilitation experience, and cross-functional communication abilities. Facilitators need training in identifying waste, understanding flow dynamics, and guiding diverse teams through collaborative mapping sessions, with many organizations finding that certified lean practitioners deliver more comprehensive assessments and sustainable improvement implementations.
-
Great quality product.
-
Topic best represented with attractive design.