

Visualization Research Branches Bivariate Analysis Techniques For Data Visualization




Try Before you Buy Download Free Sample Product
 Impress Your
Audience
 100%
Editable
 Save Hours
of Time


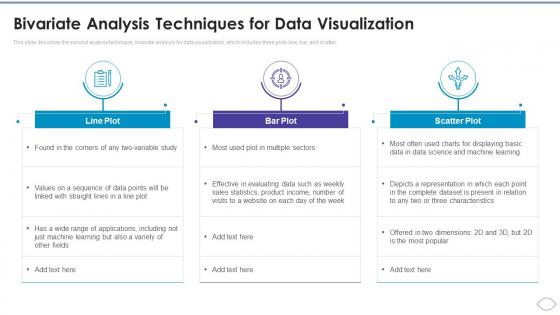
This slide describes the second analysis technique, bivariate analysis for data visualization, which includes three plots line, bar, and scatter.
This slide describes the second analysis technique, bivariate analysis for data visualization, which includes three plots line, bar, and scatter. Introducing Visualization Research Branches Bivariate Analysis Techniques For Data Visualization to increase your presentation threshold. Encompassed with three stages, this template is a great option to educate and entice your audience. Dispence information on Line Plot, Bar Plot, Scatter Plot, Data Points, Evaluating Data, using this template. Grab it now to reap its full benefits.
People who downloaded this PowerPoint presentation also viewed the following :
Visualization Research Branches Bivariate Analysis Techniques For Data Visualization with all 6 slides:
Use our Visualization Research Branches Bivariate Analysis Techniques For Data Visualization to effectively help you save your valuable time. They are readymade to fit into any presentation structure.





Most Relevant Reviews
-
Wonderful templates design to use in business meetings.
-
I can say with full confidence that all your business, academic, or professional work requirements will be sufficed with SlideTeam. Their gallery is as rich as 2Million+!!