


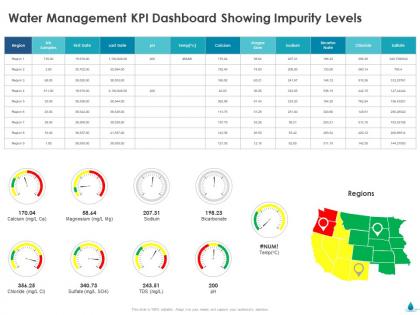
Water management kpi dashboard showing impurity levels ppt model




Try Before you Buy Download Free Sample Product
 Impress Your
 Audience
 100%
100% Editable
 Save Hours
 of Time


Our Water Management KPI Dashboard Showing Impurity Levels Ppt Model are topically designed to provide an attractive backdrop to any subject. Use them to look like a presentation pro.
People who downloaded this PowerPoint presentation also viewed the following :
Water management kpi dashboard showing impurity levels ppt model with all 2 slides:
Use our Water Management KPI Dashboard Showing Impurity Levels Ppt Model to effectively help you save your valuable time. They are readymade to fit into any presentation structure.
FAQs for Water management kpi dashboard showing impurity
Critical water management KPIs include consumption efficiency ratios, leak detection rates, water quality compliance scores, distribution pressure metrics, and cost per unit delivered. These indicators enable utilities and organizations to optimize resource allocation, minimize waste through early leak identification, and ensure regulatory compliance, with many municipal systems and industrial facilities finding that comprehensive KPI tracking delivers significant operational savings and enhanced service reliability.
A KPI dashboard enhances water resource management decision-making by providing real-time visibility into consumption patterns, leak detection metrics, quality indicators, and distribution efficiency. Through automated monitoring and predictive analytics, water utilities can identify infrastructure issues early, optimize resource allocation, and respond to emergencies faster, ultimately delivering cost savings and improved service reliability while ensuring regulatory compliance.
Data visualization transforms complex water metrics into intuitive charts, graphs, heat maps, and trend analyses that enable quick decision-making and pattern recognition. Through visual dashboards, water utilities can instantly identify consumption spikes, detect leak patterns, and monitor quality parameters, while regulatory bodies and municipal managers can track compliance metrics and resource allocation efficiency, ultimately delivering faster response times and more strategic water management decisions.
Tools for creating water management KPI dashboards include Tableau, Power BI, Qlik Sense, SCADA systems, and IoT sensor platforms. These technologies streamline water utility operations by enabling real-time monitoring, predictive analytics, and automated reporting, with many municipalities and industrial facilities finding that integrated dashboards ultimately deliver improved resource efficiency and regulatory compliance.
Real-time data integration enhances water management by enabling immediate detection of leaks, optimizing distribution pressure, and automating quality monitoring responses. Through smart sensors and IoT networks, utilities can reduce water loss by up to 30%, accelerate maintenance responses, and ensure regulatory compliance, ultimately delivering cost savings and improved service reliability.
A comprehensive water quality dashboard should include pH levels, dissolved oxygen concentrations, turbidity measurements, bacterial contamination indicators, and chemical pollutant concentrations. These metrics enable municipalities, industrial facilities, and environmental agencies to monitor compliance standards, identify contamination sources, and implement corrective measures proactively, ultimately delivering safer water supplies and regulatory adherence.
Water management dashboards can be customized by adjusting metrics, visualizations, and reporting frequencies to match specific stakeholder needs and operational priorities. Municipalities typically focus on distribution efficiency, leak detection, and regulatory compliance, while agricultural stakeholders emphasize irrigation optimization, crop water usage, and weather integration, with many organizations finding that tailored interfaces ultimately deliver more actionable insights and faster decision-making.
**INPUT**: What are the biggest challenges in measuring and reporting water-related KPIs? **OUTPUT**: The biggest challenges include inconsistent data collection methods, fragmented monitoring systems, regulatory compliance complexity, seasonal variability tracking, and integrating multiple water sources into unified reporting frameworks. These obstacles streamline through automated monitoring technologies, standardized measurement protocols, and integrated dashboard solutions, with utilities, manufacturing facilities, and municipalities finding that comprehensive water management systems ultimately deliver enhanced operational efficiency and regulatory transparency.
A KPI dashboard optimizes water distribution by monitoring flow rates, pressure levels, consumption patterns, leak detection metrics, and system efficiency indicators in real-time. Through automated alerts and predictive analytics, water utilities can identify infrastructure issues, adjust distribution schedules, and minimize losses, with many municipalities finding that data-driven management reduces wastage by 15-30% while improving service reliability.
Benchmarking in water management KPIs enables organizations to compare performance against industry standards, identify improvement opportunities, and establish realistic targets for efficiency gains. This strategic approach helps utilities and facilities optimize resource allocation, reduce operational costs, and enhance conservation efforts, with many water systems finding that benchmarking delivers measurable improvements in both sustainability and financial performance.
Community engagement can be incorporated through stakeholder feedback metrics, public participation rates, citizen reporting systems, community satisfaction surveys, and transparent data sharing mechanisms. These engagement tools enhance accountability, build trust, and enable collaborative water stewardship, with municipalities increasingly finding that active community involvement improves conservation outcomes and strengthens public support for water management initiatives.
Predictive analytics can enhance water management KPIs through demand forecasting, leak detection algorithms, quality trend analysis, infrastructure failure prediction, and consumption pattern modeling. These technologies streamline operations by identifying potential issues before they escalate, optimizing resource allocation, and reducing maintenance costs, with many utilities finding that predictive insights ultimately deliver improved service reliability and significant operational savings.
Regulatory requirements directly shape water management KPIs by mandating specific compliance metrics like discharge limits, quality standards, consumption thresholds, and environmental impact indicators. These regulations drive organizations to track parameters such as pH levels, chemical concentrations, and usage efficiency, with utilities and manufacturing companies finding that comprehensive KPI monitoring streamlines compliance reporting while minimizing regulatory risks.
Water management KPI dashboard success stories include Singapore's PUB reducing water losses by 40%, Cape Town preventing Day Zero through real-time monitoring, and Coca-Cola achieving water neutrality across facilities. These organizations streamlined resource allocation, enhanced operational efficiency, and accelerated conservation efforts, with many utilities finding that data-driven insights ultimately deliver cost savings and sustainable competitive advantage.
Periodic KPI reviews enable continuous improvement by identifying performance trends, revealing operational inefficiencies, and highlighting areas requiring strategic intervention or resource reallocation. Through systematic analysis, water utilities can adjust treatment processes, optimize distribution networks, and enhance conservation strategies, with many organizations finding that regular assessments ultimately deliver reduced costs, improved service reliability, and stronger regulatory compliance.
-
Thanks for all your great templates they have saved me lots of time and accelerate my presentations. Great product, keep them up!
-
Content of slide is easy to understand and edit.
-
Perfect template with attractive color combination.
-
Qualitative and comprehensive slides.