


Website Analytics Report KPI Dashboard Snapshot




Try Before you Buy Download Free Sample Product
 Impress Your
 Audience
 100%
100% Editable
 Save Hours
 of Time


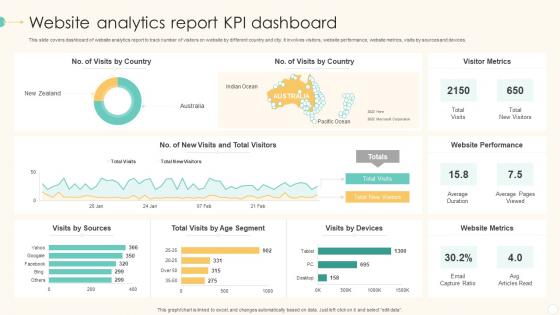
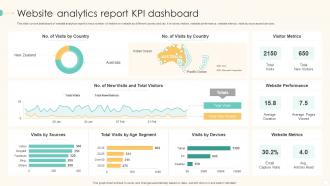
This slide covers dashboard of website analytics report to track number of visitors on website by different country and city. It involves visitors, website performance, website metrics, visits by sources and devices.
People who downloaded this PowerPoint presentation also viewed the following :
Website Analytics Report KPI Dashboard Snapshot with all 7 slides:
Use our Website Analytics Report KPI Dashboard Snapshot to effectively help you save your valuable time. They are readymade to fit into any presentation structure.






FAQs for Website Analytics Report
Key website analytics metrics include traffic volume, bounce rate, session duration, conversion rates, and user acquisition channels. These metrics streamline performance evaluation by revealing visitor behavior patterns, identifying content effectiveness, and optimizing user experiences, with many organizations finding that tracking these comprehensive indicators ultimately delivers improved engagement and competitive advantage.
Website analytics influences conversion rate optimization by identifying user behavior patterns, pinpointing conversion bottlenecks, tracking page performance metrics, and revealing drop-off points throughout the customer journey. Through detailed data analysis, businesses can optimize landing pages, streamline checkout processes, and personalize user experiences, with many e-commerce and service companies finding that data-driven improvements deliver significantly higher conversion rates and enhanced customer engagement.
Google Analytics, Adobe Analytics, Hotjar, SEMrush, and Mixpanel are among the most effective tools for collecting comprehensive website analytics data. These platforms enhance decision-making by tracking user behavior, measuring conversion rates, and monitoring traffic sources, with many organizations finding that strategic combination of multiple tools delivers deeper insights and competitive advantage.
User demographics significantly influence website analytics interpretation by revealing audience behaviors, preferences, engagement patterns, and conversion tendencies across different age groups, locations, and interests. Understanding demographic data enables businesses to tailor content strategies, optimize user experiences, and allocate marketing resources more effectively, with many organizations finding that demographic-specific insights ultimately deliver higher conversion rates and improved customer targeting.
Heat mapping reveals user interaction patterns by tracking clicks, scrolls, mouse movements, and attention focus across web pages, showing where visitors engage most and least. Through visual data representation, businesses can identify navigation bottlenecks, optimize content placement, and enhance user experience design, with many e-commerce and service companies finding that heat map insights significantly improve conversion rates and reduce bounce rates.
A/B testing integrates with website analytics through conversion tracking, user behavior analysis, statistical significance monitoring, and performance measurement across different page variants. This strategic combination enables businesses to optimize customer experiences, increase conversion rates, and enhance user engagement, with many e-commerce and SaaS companies finding that data-driven testing delivers measurable improvements in revenue and user satisfaction.
Common pitfalls include ignoring mobile analytics, focusing solely on vanity metrics like page views, neglecting conversion funnel analysis, making decisions on insufficient data samples, and overlooking user behavior patterns. These mistakes often result in misguided marketing strategies, poor resource allocation, and missed optimization opportunities, with many organizations finding that comprehensive data interpretation delivers significantly better ROI and customer experiences.
Website analytics should be reviewed daily for immediate issues, weekly for tactical adjustments, monthly for strategic insights, and quarterly for comprehensive performance evaluation. This multi-layered approach enables businesses to quickly address technical problems, optimize campaigns, adjust content strategies, and make informed long-term decisions, with many organizations finding that regular review cycles significantly improve conversion rates and user engagement.
Analyzing traffic sources reveals visitor acquisition patterns, campaign effectiveness, referral relationships, search performance, and direct brand engagement levels. These insights enable marketers to optimize high-performing channels, reallocate budgets from underperforming sources, and identify partnership opportunities, with many organizations finding that strategic source analysis ultimately delivers improved ROI and sustainable traffic growth.
Website analytics help identify high-performing content by tracking metrics like page views, time on page, bounce rates, social shares, and conversion rates across different content pieces. Through tools like Google Analytics, businesses can pinpoint which blog posts, product pages, or resources generate the most engagement and leads, ultimately enabling content teams to replicate successful formats and topics for sustained growth.
High bounce rates indicate visitors aren't engaging with content, potentially signaling poor user experience, irrelevant content, or slow loading times, which can negatively impact SEO rankings and conversion rates. While some single-page visits are natural for informational sites, consistently elevated bounce rates across e-commerce platforms and service websites ultimately reduce lead generation, customer acquisition, and revenue potential.
Businesses can use funnel analysis to identify where users drop off during key conversion paths, revealing bottlenecks in checkout processes, form completions, or registration flows. By analyzing these friction points, companies can optimize page layouts, streamline navigation, and enhance user experiences, with many e-commerce and SaaS organizations finding significant improvements in conversion rates and customer acquisition costs.
Quantitative analytics measure numerical data like page views, bounce rates, conversion rates, and user demographics, while qualitative analytics examine user behavior through heatmaps, session recordings, and feedback surveys. These complementary approaches enable businesses to understand both what users do and why they do it, with e-commerce and SaaS companies finding that combining both delivers deeper insights for optimization.
Website analytics inform SEO strategies by revealing keyword performance, user behavior patterns, page engagement metrics, traffic sources, and conversion pathways. Through tools like Google Analytics, businesses can identify high-performing content, optimize underperforming pages, and refine targeting approaches, ultimately delivering improved search rankings and increased organic visibility in an increasingly competitive digital landscape.
Mobile traffic analytics holds tremendous significance as mobile devices now generate over half of global web traffic, requiring businesses to optimize user experiences, conversion funnels, and site performance specifically for smaller screens. These insights enable organizations to identify mobile-specific behavioral patterns, streamline checkout processes, and enhance page load speeds, ultimately delivering improved customer engagement and competitive advantage in an increasingly mobile-first marketplace.
-
Wonderful templates design to use in business meetings.
-
Use of different colors is good. It's simple and attractive.