

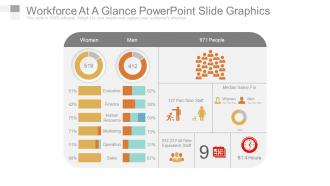
Belegschaft auf einen Blick Powerpoint-Foliengrafik





Try Before you Buy Download Free Sample Product
 Impress Your
Audience
 100%
Editable
 Save Hours
of Time


Als Personalverantwortlicher müssen Sie die Belegschaft des Unternehmens analysieren, planen und bewerten. Hier erweist sich diese PowerPoint-Präsentationsfolie zur Personalanalyse und -planung als effektives Werkzeug für Sie. Die Folie deckt die verschiedenen Details der Personalplanung ab und ist somit ein Komplettpaket für Ihren Bericht. Es deckt alle Details ab, die dazu beitragen, eine starke Belegschaft aufzubauen, die das wichtigste Kapital für jedes Unternehmen ist. Die kontinuierliche Notwendigkeit, die Bedürfnisse und Prioritäten der Organisation mit denen ihrer Belegschaft in Einklang zu bringen, um sicherzustellen, dass sie ihre gesetzlichen, behördlichen, Service- und Produktionsanforderungen und Organisationsziele erfüllen kann, kann mit dieser aufwendig gestalteten Vorlage gut beantwortet werden. Dieses Design erleichtert Ihnen die Aufgabe als Personalmanager und hilft Ihnen, das richtige Team aufzubauen. Die grafischen Symbole machen es zu einem erstaunlichen Werkzeug für die Implementierung von Techniken zur Personaloptimierung. Details wie Durchschnittsgehalt, Teilzeitkräfte, gleichwertige Vollzeitkräfte, Führungsteam, Finanzteam, Personalteam, Vertriebsteam wurden berücksichtigt. Das Diagramm ist eine Kombination aus Grafiken und Tabellen sowie Daten und Symbolen. Die farbigen Icons erhöhen die optische Attraktivität der Folie. Verwenden Sie also diese passende PowerPoint-Präsentationsfolie zur Personalanalyse und -planung, um sich einen Namen zu machen. Verabschieden Sie sich vom Fluch mit unseren Powerpoint-Foliengrafiken auf einen Blick. Ermöglichen Sie den Leuten, ihr Glück zu beenden.
People who downloaded this PowerPoint presentation also viewed the following :
Mitarbeiter auf einen Blick Powerpoint-Foliengrafiken mit allen 4 Folien:
Finden Sie heraus, wie Sie die Funktionsweise mit unseren Powerpoint-Foliengrafiken auf einen Blick verbessern können. Es hilft bei der Durchführung einer internen Analyse.


FAQs for Workforce at a glance
Honestly, you need three big things: good data setup, clear goals, and leadership that actually cares. Start by connecting your HR systems, performance data, engagement surveys - whatever you've got that's not talking to each other right now. Figure out what winning looks like first though. Are you trying to stop people from quitting? Boost productivity? Find your top performers? Build your analytics team (or hire someone who knows what they're doing). Set up privacy rules because that stuff matters. But here's the thing - make sure people actually use the insights instead of creating fancy reports that just collect dust.
So workforce analytics is basically your early warning system for when people are about to quit. Look at your data - which teams seem miserable, who's calling out sick constantly, performance dropping off. I swear it's like reading tea leaves but with actual numbers backing you up. Once you spot the patterns, do something about it. Maybe Sarah's team needs a new manager, or your sales people need clearer promotion paths. The worst thing? Companies that obsess over collecting all this data then just... sit on it. Don't be those people.
So predictive analytics is basically like having a crystal ball for your team. You can spot who's about to quit, figure out when you'll need to hire more people, and see what skills you're gonna be missing. The crazy part? It catches patterns we'd never notice - like how someone's engagement scores might predict they'll bounce in 3 months. I'd honestly start with just tracking turnover since that's usually the biggest headache. From there you can get into succession planning and all that fancy stuff. It's actually pretty wild how accurate it gets once you have enough data.
Honestly, workforce analytics makes this so much easier than doing it manually. Start with a skills inventory survey - combine that with your performance reviews and training data. You'll quickly see what people actually know versus what they claim (spoiler: there's always a gap). Compare all that against where your business is headed and what projects are coming up. The data shows you exactly which teams are missing key skills and who needs development most. I'd bet money you'll find some surprising gaps you didn't even know existed. Way better than guessing what you need.
Start with your HRIS - that's got all the employee basics like demographics and performance data. Payroll shows compensation trends, and your ATS has hiring metrics. Exit interviews are honestly where you'll find the best stuff about why people actually leave. Survey data's useful too if you do those regularly. Learning platforms track who's developing skills, and weirdly enough, Slack or Teams data can show you how teams really interact. Don't try grabbing everything right away though - pick what's easiest to access first and build from there.
Honestly, start by pulling your current demographic data and see how it maps against your org chart - that'll show you exactly where the gaps are. You can track representation across departments and levels instead of just guessing where problems might be. The pay equity analysis is probably the biggest win though. Spot compensation disparities before they become lawsuits, you know? Look for patterns in hiring and promotions too - sometimes there's unconscious bias happening that's super obvious once you see the numbers. And don't forget to actually measure if your D&I programs are working or just burning budget.
Workforce analytics can be a game changer for small businesses, honestly. You'll make way better hiring choices and figure out why certain employees are crushing it while others aren't. The data shows you turnover patterns before people actually quit - super helpful. Plus you can spot where you're wasting money on overstaffing or missing opportunities because you're stretched too thin. Some insights will totally catch you off guard! I'd start with basic stuff first though, like tracking how long it takes to hire someone and simple satisfaction surveys. The fancy predictive analytics can wait until you get comfortable with the fundamentals.
Data quality is your biggest headache - everything's scattered across different systems and half of it's inconsistent garbage. Leadership buy-in is tough too since most execs think workforce analytics is just a fancy nice-to-have. Privacy stuff gets tricky fast when you're dealing with employee data. Most HR teams can't handle the technical side either, so you'll need to train people or bring in data folks. Oh, and executives love to say they want "insights" but then ignore anything that doesn't confirm what they already think. Start with one small project to show it actually works before going big.
So workforce analytics is basically taking all those HR hunches and turning them into actual data you can use. Why is turnover so high? Which teams are falling behind? Now you'll know instead of just guessing. Think of it like having x-ray vision for your whole company - honestly pretty fascinating once you dive in. You can catch problems early, figure out who your real stars are (not just who talks the loudest), and hire people based on what actually works at your place. My advice? Don't go crazy with it at first. Just pick one thing that's bugging you and start there.
Honestly, just be upfront about what data you're grabbing and why. People hate feeling watched at work - trust me on that one. Watch out for biased algorithms that could screw over certain groups during hiring or reviews. Only collect stuff you actually need and keep it locked down tight. Oh, and use the insights to help your team grow, not just track their every move. I'd start by checking what you're already doing wrong (we all have blind spots) and get HR to help write some actual guidelines. The whole point should be supporting people, not playing Big Brother.
Dude, workforce analytics seriously changes everything about recruiting. Track where your best hires actually come from - you'll be shocked how useless some job boards are. Time-to-hire and source quality should be your starting metrics. The data shows you exactly where candidates bail out during your process, which is honestly eye-opening. I've seen companies realize their top performers all share weird patterns, like coming from the same three schools or having this one random skill combo. Way better than just winging it based on hunches. Oh, and you can finally see which recruiting stages drag on forever.
Honestly, forget tracking hours - that's such old school thinking. Focus on revenue per employee first, that's what actually matters to your bottom line. Then add in quality stuff like error rates and customer satisfaction. Oh, and how fast new hires get up to speed! That metric is gold but nobody pays attention to it. Don't skip engagement and turnover rates either. Miserable employees don't produce good work, period. Start with maybe 3-4 metrics that connect to your real business goals. You can always add more later once you've got the basics down.
Dude, workforce analytics is seriously worth looking into. Instead of guessing who's doing well, you get actual data on stuff like project completion rates and collaboration patterns. I was skeptical at first but it really helps spot performance issues before they blow up during reviews. You can see who your top performers are early and figure out where people need more training. Makes promotion decisions way less awkward too since you're not just going off whatever happened last week. Honestly? Just pick 2-3 metrics that actually matter for your team and stick with tracking those consistently.
Honestly, everyone's going crazy for AI-powered analytics right now - predicting turnover, spotting high-potential people before other companies snag them. Real-time sentiment tracking is huge too. Skills mapping is where I'd start if you're behind on this stuff. Companies are ditching basic engagement surveys for deeper metrics like collaboration patterns and digital body language (whatever that means, right?). Privacy regulations are a total headache though. Most places are scrambling to stay compliant while still collecting useful workforce data. The smart ones are using all this to map internal mobility paths and do better workforce planning.
Dude, real-time workforce analytics is a game changer. You catch problems while they're happening instead of finding out weeks later through some boring report. Like, you'll notice your team's drowning in work or certain tasks are eating up way more time than they should. Bottlenecks become obvious super fast. Honestly, I got a little obsessed with checking the dashboard when we first set it up - probably not healthy lol. But you can actually DO something about issues immediately. Move people around, fix broken processes, whatever. My advice? Don't try to track everything at once. Pick one metric that matters and go from there.
-
Very unique, user-friendly presentation interface.
-
Graphics are very appealing to eyes.