

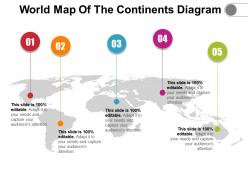
World map of the continents diagram






Try Before you Buy Download Free Sample Product
 Impress Your
Audience
 100%
Editable
 Save Hours
of Time


Get this World Map Of The Continents Diagram PowerPoint presentation to present your business data effectively to your clients. You can depict graphical representations of data that utilize color-coded systems with this data interpretation PPT visual. For better visualization of the volume of locations/events within a dataset, you can take the assistance of this graphical PowerPoint infographic. Take the advantage of this graphical tool PPT template, to direct viewers towards areas of higher valuations. Present the economic viability of each of the prime factors and undertake various expansion missions by utilizing this geographical base PowerPoint template. The airline industry can employ this PowerPoint template to showcase the aircraft route density to the customers. Hence download this world map PowerPoint slide design to showcase the population, temperature, world stock market density, carbon dioxide concentration in an effective pictorial manner.
People who downloaded this PowerPoint presentation also viewed the following :
World map of the continents diagram with all 5 slides:
Add to your clout with our World Map Of The Continents Diagram. Achieve a higher degree of influence.


FAQs for World map of
Continental topography varies dramatically, with Asia featuring the world's highest mountains and largest plateaus, Africa showcasing vast deserts and rift valleys, North America displaying diverse mountain ranges and plains, and South America containing extensive rainforests and the Andes chain. These geographic distinctions enable businesses to understand regional logistics challenges, resource distribution patterns, and market accessibility factors, ultimately delivering strategic insights for global expansion planning and supply chain optimization.
Continental positioning significantly influences global climate through ocean current patterns, wind circulation systems, and heat distribution mechanisms. Large landmasses like Asia create monsoon systems, while continent-ocean arrangements drive currents like the Gulf Stream, ultimately affecting regional temperatures, precipitation patterns, and seasonal variations that shape diverse climate zones worldwide.
Tectonic plate movements drive continental formation through seafloor spreading, subduction, and collision processes that create, separate, and merge landmasses over millions of years. These geological forces shape mountain ranges, ocean basins, and continental boundaries, with geologists and educational institutions finding that understanding plate tectonics enhances geographic literacy and strategic resource planning across industries.
A continents map helps understand biodiversity by illustrating how geographic isolation, climate zones, and continental drift shaped distinct ecosystems across landmasses. Through visual representation of continental boundaries and connections, researchers can analyze species distribution patterns, migration routes, and evolutionary adaptations, with conservation organizations and educational institutions finding that spatial context enhances biodiversity planning and ecosystem management strategies.
Historical continental border changes include post-colonial independence movements, the dissolution of empires like the Soviet Union and Yugoslavia, African decolonization, and the formation of new nations through partition or unification. These transformations reflect cultural shifts toward self-determination, ethnic nationalism, religious identity, and economic integration, with many regions finding that border modifications ultimately enable stronger cultural preservation and political autonomy.
Human activities reshape continental maps through urbanization expanding city boundaries, deforestation altering land cover patterns, agricultural development changing rural landscapes, and infrastructure projects creating new transportation networks. These transformations require frequent cartographic updates, with mapping organizations increasingly using satellite imagery and GIS technology to track urban sprawl, forest loss, and land use changes, ultimately delivering more accurate geographic data for planning and environmental monitoring.
Continents map creation utilizes satellite imagery, Geographic Information Systems (GIS), remote sensing technology, Global Positioning Systems (GPS), and cartographic software like ArcGIS and QGIS. These technologies streamline mapping by capturing real-time geographical data, processing topographical information, and enabling precise coordinate plotting, with many geographical institutions finding that integrated digital platforms ultimately deliver enhanced accuracy and faster map production for educational and commercial applications.
Continents maps aid natural disaster preparedness by identifying high-risk zones, tracking weather patterns, coordinating international relief efforts, and establishing evacuation routes across regions. These comprehensive mapping tools enable emergency agencies to streamline response protocols, facilitate cross-border collaboration, and enhance resource allocation, with many organizations finding that regional visualization ultimately delivers faster emergency response and improved disaster management coordination.
Economic resources vary dramatically across continents, with Africa leading in diamonds, gold, and cobalt, while the Middle East dominates oil reserves, and South America excels in lithium and copper. These geographical distributions create strategic advantages for different regions, with many countries leveraging their natural endowments to drive economic growth, attract international investment, and establish competitive positions in global supply chains.
Educational strategies for continent comprehension include interactive digital mapping, comparative size exercises, cultural overlay activities, climate zone visualization, and hands-on puzzle assemblies. These approaches enhance geographical literacy by connecting physical boundaries with cultural contexts, economic patterns, and environmental characteristics, with many educators finding that multi-sensory mapping activities significantly improve spatial reasoning and global awareness skills.
Maps of continents support geopolitical analysis by visualizing territorial boundaries, resource distributions, strategic waterways, and regional power dynamics that influence international relations. Through detailed continental mapping, diplomats and analysts assess trade routes, military positioning, and economic partnerships across regions like Asia-Pacific or Europe, ultimately enabling more informed foreign policy decisions and strategic alliance formations.
Cartography revolutionized continental understanding by enabling accurate navigation, territorial documentation, and cultural exchange throughout history. Ancient civilizations like Greece and medieval Islamic scholars advanced mapping techniques, while European exploration periods used cartographic innovations to establish trade routes, colonial territories, and scientific knowledge, ultimately shaping global commerce and geopolitical boundaries that influence modern international relations.
Cultural representations of continents vary significantly through historical perspectives, colonial influences, educational systems, and regional viewpoints that shape how societies perceive geographical relationships. These differences manifest in cartographic choices, cultural narratives, and educational curricula, with many institutions finding that diverse continental representations enhance global understanding, promote cultural awareness, and ultimately deliver more comprehensive geographical education across increasingly interconnected educational environments.
Climate change impacts continental boundaries through rising sea levels, coastal erosion, and shifting ice sheets, particularly affecting Antarctica's ice shelves and low-lying coastal regions across all continents. While geological continental boundaries remain largely stable, many nations are experiencing significant coastal retreat and island submersion, with countries like Bangladesh, Netherlands, and Pacific Island states finding that strategic coastal management and adaptation planning have become critical for maintaining territorial integrity and economic stability.
Interactive maps enhance continental learning by enabling students to explore geographical features, climate patterns, cultural diversity, and economic data through clickable elements, zoom functions, and layered information displays. These dynamic tools transform passive memorization into active discovery, with many educational institutions finding that students retain geographical concepts more effectively while developing stronger spatial reasoning and global awareness skills.
-
Excellent products for quick understanding.
-
Awesome presentation, really professional and easy to edit.