


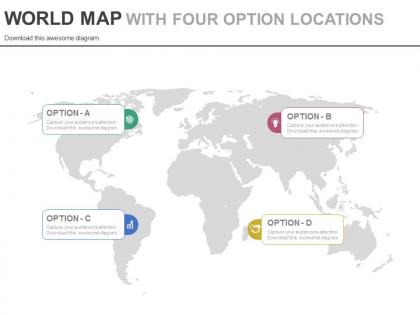
World map with four option locations powerpoint slides




Try Before you Buy Download Free Sample Product
 Impress Your
 Audience
 100%
100% Editable
 Save Hours
 of Time


Avoid ethnic disputes with our World Map With Four Option Locations Powerpoint Slides. They are designed to adapt to any culture.
People who downloaded this PowerPoint presentation also viewed the following :
World map with four option locations powerpoint slides with all 4 slides:
Folks feel consciously drawn to our World Map With Four Option Locations Powerpoint Slides. They find their enigmatic allure enticing.

FAQs for World map with four option
Effective world map PowerPoint slides should include clear geographical boundaries, consistent color coding for data representation, legible country labels, a comprehensive legend, and strategic use of visual hierarchy through contrasting colors. These design elements work together by enhancing audience comprehension, facilitating data comparison across regions, and maintaining professional presentation standards, with many organizations finding that well-designed geographical presentations significantly improve stakeholder engagement and decision-making processes.
Color-coding significantly enhances world map presentation readability by creating visual hierarchy, enabling instant data comparison, and reducing cognitive load for audiences processing complex geographical information. Through strategic color schemes, presenters can highlight regional performance metrics, demographic trends, and market opportunities, with many organizations finding that well-designed color systems streamline decision-making processes and improve stakeholder engagement during global strategy discussions.
Best practices for labeling countries on world maps include using consistent font sizes, strategic color contrast, readable typography, selective labeling of relevant nations, and clear hierarchical emphasis. These approaches enhance audience comprehension by minimizing visual clutter, highlighting key geographical relationships, and maintaining professional aesthetics, with many presenters finding that focused labeling delivers stronger messaging impact than attempting comprehensive coverage.
Animated transitions enhance world map presentations by directing audience attention, revealing data progressively, and creating visual storytelling flow through smooth country highlights, zoom effects, and sequential data reveals. These dynamic elements transform static geographical information into compelling narratives, enabling presenters to guide viewers through complex global data while maintaining engagement and improving information retention across international business presentations.
When choosing a projection type for world map slides, consider your audience's geographical focus, data accuracy requirements, visual appeal, and presentation purpose. Mercator projections work well for navigation-focused content, while Robinson or Winkel Tripel projections offer balanced global perspectives for international business presentations, ultimately delivering clearer geographical context and enhanced audience comprehension.
World map slides enhance business presentations by visualizing global market penetration, regional performance metrics, expansion opportunities, international partnerships, and competitive landscapes across different territories. These visual tools enable presenters to communicate complex geographical data effectively, helping stakeholders quickly identify growth markets, resource allocation priorities, and strategic partnerships, while facilitating data-driven discussions about international business strategies and market positioning.
World map PowerPoint slides can integrate choropleth mapping, heat maps, bubble charts, flow diagrams, and interactive data overlays to visualize geographic information effectively. These techniques enable presenters to display regional sales performance, demographic trends, and market penetration across different countries, while data callouts and color-coded legends enhance audience comprehension, ultimately delivering compelling geographic storytelling.
World map slide accessibility involves using high contrast colors, descriptive alt text for screen readers, clear font sizes, and avoiding color-only data differentiation. These design principles enhance readability by incorporating text labels, consistent visual hierarchies, and scalable graphics, with many presenters finding that accessible maps ultimately deliver broader audience engagement and more effective global communication across diverse organizational settings.
**INPUT**: What tools or software can assist in creating custom world map PowerPoint slides? **OUTPUT**: Tools for creating custom world map PowerPoint slides include PowerPoint's built-in SmartArt and icons, Adobe Illustrator, Canva, Lucidchart, and specialized mapping platforms like MapChart. These solutions streamline design workflows by offering pre-built templates, vector graphics, and customizable elements, with many organizations finding that professional presentation platforms deliver polished, scalable visuals for global business communications.
Font choice significantly impacts world map PowerPoint slide clarity through size, contrast, readability, and visual hierarchy considerations. Sans-serif fonts like Arial or Calibri enhance legibility against complex geographical backgrounds, while appropriate sizing ensures labels remain visible during presentations, with many presenters finding that consistent font families and adequate spacing ultimately deliver professional clarity and audience comprehension.
Common pitfalls include using outdated maps with incorrect borders, overcrowding with excessive data points, choosing colors that obscure geographical details, and selecting inappropriate projections that distort regions. These design mistakes can undermine presentation credibility and audience comprehension, with many organizations finding that clean, accurate world map slides enhance global business discussions and strategic planning effectiveness.
Geographic data can be effectively communicated through world map visuals using color-coded regions, proportional symbols, heat maps, interactive overlays, and statistical annotations. These visualization techniques enable organizations to present complex international data sets, regional performance metrics, and global trends in an immediately comprehensible format, with many multinational corporations and research institutions finding that strategic map-based presentations enhance stakeholder understanding and accelerate decision-making processes.
World map PowerPoint slides serve as powerful visual anchors in educational presentations, enabling geography lessons, historical context, cultural studies, international relations, and global data visualization. These slides help educators transform abstract concepts into concrete understanding by illustrating migration patterns, trade routes, climate zones, and demographic trends, ultimately enhancing student engagement and retention across diverse academic disciplines.
Interactive elements like clickable regions, hover effects, animated data overlays, zoom functionality, and embedded multimedia significantly enhance world map slide engagement by transforming passive viewing into active exploration. These features enable presenters to create dynamic storytelling experiences, allow audiences to discover information at their own pace, and facilitate deeper understanding of geographic data, ultimately delivering more memorable presentations and improved knowledge retention across business, educational, and analytical contexts.
World map slides have proven effective in global expansion presentations by tech companies showcasing market penetration, international sales reports demonstrating regional performance across continents, and consulting firms illustrating client distribution and strategic partnerships worldwide. These presentations enhance audience understanding by providing visual context for geographic data, enabling executives to identify growth opportunities, communicate global reach more effectively, and ultimately deliver more compelling narratives that drive strategic decision-making across diverse international markets.
-
Informative presentations that are easily editable.
-
Great product with effective design. Helped a lot in our corporate presentations. Easy to edit and stunning visuals.