

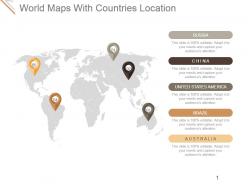
World maps with countries location presentation diagrams






Try Before you Buy Download Free Sample Product
 Impress Your
Audience
 100%
Editable
 Save Hours
of Time


Chalk out your future with our World Maps With Countries Location Presentation Diagrams. Create a detailed chart to follow.
People who downloaded this PowerPoint presentation also viewed the following :
World maps with countries location presentation diagrams with all 5 slides:
Our World Maps With Countries Location Presentation Diagrams can change colors like a chameleon. Get an experience of their adaptive ability.


FAQs for World maps with countries
World maps for displaying country locations include political maps, physical maps, thematic maps, interactive digital maps, and projection-specific maps like Mercator or Robinson. These cartographic tools enhance geographical understanding by highlighting national boundaries, topographical features, and demographic data, with many educational institutions, businesses, and government organizations finding that strategic map selection delivers clearer communication and better spatial analysis.
Geographic information systems enhance country location diagrams by integrating satellite data, GPS coordinates, topographic mapping, and real-time boundary updates to ensure precise territorial representations. Through advanced spatial analysis tools, cartographers and government agencies deliver significantly more accurate border delineations, population density overlays, and infrastructure mapping, while minimizing traditional surveying errors, ultimately enabling better resource allocation and strategic planning across industries.
Color schemes enhance map readability and data interpretation by distinguishing countries, regions, and demographic information through strategic visual differentiation. These carefully chosen palettes enable businesses, educational institutions, and government organizations to communicate geographical data more effectively, with many finding that consistent color coding across presentations streamlines audience comprehension and supports more impactful decision-making processes.
Political boundaries significantly influence map depiction through territorial disputes, recognition status, administrative divisions, and sovereignty claims, creating variations across different map publishers and countries. These geopolitical considerations affect how contested regions, emerging nations, and disputed territories appear, with many organizations finding that boundary representation must balance accuracy with diplomatic sensitivities, ultimately delivering contextually appropriate geographical information for diverse audiences.
3D world maps for country visualization offer enhanced spatial understanding, improved depth perception, realistic geographic relationships, interactive engagement capabilities, and superior visual impact for presentations. These dynamic visualizations help audiences better comprehend relative country sizes, continental positioning, and global connectivity, with many educational institutions and international businesses finding that 3D representations significantly enhance geographic learning outcomes and strategic planning discussions.
Cultural factors significantly influence country location diagram design through color symbolism, directional preferences, regional groupings, typography choices, and symbolic representations that resonate with specific audiences. These considerations ensure diagrams communicate effectively across diverse markets, with many international organizations finding that culturally-adapted visualizations enhance comprehension and engagement while avoiding potential misinterpretations or cultural sensitivities.
Geographic Information Systems (GIS) software like ArcGIS and QGIS, along with design platforms such as Adobe Illustrator, Canva, and Mapbox, deliver comprehensive mapping capabilities for custom country location visualizations. These tools streamline map creation through intuitive interfaces, extensive geographic databases, and professional styling options, with many organizations finding that combining specialized GIS accuracy with user-friendly design platforms ultimately enhances presentation quality and stakeholder engagement.
Interactive maps significantly enhance user engagement by enabling real-time data visualization, clickable hotspots, zoom functionality, customizable layers, and dynamic filtering capabilities. Through these features, organizations across sectors like retail, logistics, and tourism deliver personalized experiences, streamline navigation, and provide actionable insights, ultimately transforming passive viewing into active exploration while boosting user retention.
When choosing a world map template for presentations, consider visual clarity, data compatibility, audience relevance, customization flexibility, and professional design quality. Templates should accommodate your specific data visualization needs, whether highlighting regional markets, global operations, or demographic trends, while ensuring geographic accuracy and brand consistency ultimately enhance audience engagement and message effectiveness.
Historical events fundamentally reshape cartographic representation through territorial changes from wars, colonization, independence movements, and political negotiations. These transformations create new borders, merge or divide nations, and establish sovereign states, with many regions like Eastern Europe, Africa, and the Middle East experiencing dramatic boundary shifts that continue influencing modern geopolitical mapping and international relations.
Common mistakes include using inaccurate geographic boundaries, selecting inappropriate color schemes that reduce visibility, overcrowding maps with excessive text or data points, and neglecting to maintain consistent scaling across regions. These design flaws can mislead audiences and undermine credibility, with many organizations finding that clean, accurate visualizations with strategic color coding and balanced information density ultimately deliver clearer communication and stronger stakeholder engagement.
Data visualization techniques enhance geographic data comprehension by incorporating color coding, layered information displays, interactive elements, proportional symbols, and dynamic filtering capabilities. These approaches enable organizations to identify patterns, trends, and correlations more effectively, with sectors like logistics, healthcare, and retail finding that enhanced visual clarity streamlines decision-making processes and delivers competitive advantages.
Incorporating demographic data into country maps delivers enhanced strategic planning, targeted market analysis, resource allocation optimization, and informed decision-making capabilities. These data-rich visualizations enable organizations to identify growth opportunities, assess market potential, and understand population distributions, with businesses, government agencies, and NGOs finding that demographic overlays significantly improve their operational efficiency and strategic positioning.
World maps vary significantly across educational levels, adapting content complexity, visual elements, labeling detail, and interactive features to match cognitive development and learning objectives. Elementary versions emphasize basic geography with colorful illustrations and major landmarks, while advanced academic maps incorporate detailed topographical data, economic indicators, and geopolitical analysis, ultimately enabling educators to deliver age-appropriate geographic literacy and global awareness.
Accessibility features for maps should include high contrast color schemes, alternative text descriptions, screen reader compatibility, scalable fonts, and keyboard navigation options. These elements enable users with visual impairments, motor disabilities, and cognitive differences to access geographical information effectively, with many organizations finding that inclusive design ultimately enhances usability for all users while expanding audience reach.
-
Design layout is very impressive.
-
Wonderful templates design to use in business meetings.