


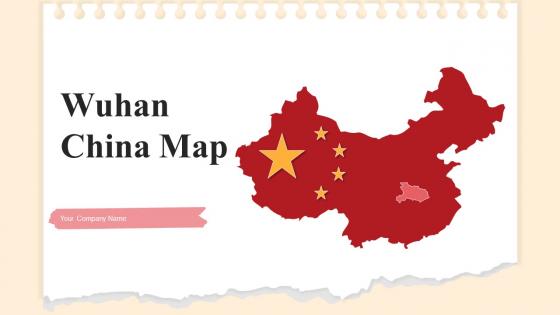
Wuhan China Map Powerpoint Ppt Template Bundles




Try Before you Buy Download Free Sample Product
 Impress Your
 Audience
 100%
100% Editable
 Save Hours
 of Time


Our Wuhan China Map Powerpoint Ppt Template Bundles are topically designed to provide an attractive backdrop to any subject. Use them to look like a presentation pro.
People who downloaded this PowerPoint presentation also viewed the following :
Wuhan China Map Powerpoint Ppt Template Bundles with all 9 slides:
Use our Wuhan China Map Powerpoint Ppt Template Bundles to effectively help you save your valuable time. They are readymade to fit into any presentation structure.






FAQs for Wuhan China Map Powerpoint
A Wuhan China Map PowerPoint template should include detailed district boundaries, major landmarks like the Yangtze River and Yellow Crane Tower, transportation networks, customizable color schemes, and editable text boxes for data integration. These features enable presenters to highlight specific regions, demonstrate market penetration strategies, showcase logistics networks, and present demographic information clearly, with many businesses finding that geographically accurate templates enhance stakeholder understanding and support strategic decision-making across various sectors.
Incorporating local landmarks like Yellow Crane Tower, East Lake, and Wuhan Yangtze River Bridge creates immediate visual recognition and cultural connection for audiences familiar with the region. These recognizable elements enhance storytelling by providing geographic context, supporting location-based data visualization, and establishing credibility, while helping presenters communicate regional strategies, market opportunities, or operational presence more effectively to stakeholders.
Best practices for customizing a Wuhan China Map PowerPoint template include adjusting color schemes to match your brand, adding relevant data overlays, incorporating custom icons and labels, utilizing layered elements for detailed presentations, and ensuring text readability across different screen sizes. These customization techniques enhance visual storytelling by highlighting specific districts for business expansion plans, adding demographic data for market analysis, and creating interactive elements for stakeholder presentations, ultimately delivering more engaging and professional presentations that resonate with your audience.
Maps in presentations enhance audience engagement by providing visual context, simplifying complex geographical data, and creating immediate spatial understanding that resonates with viewers. Through interactive elements and clear geographic visualization, organizations across sectors like logistics, retail, and urban planning find that map-based presentations significantly improve information retention, accelerate decision-making processes, and ultimately deliver more compelling stakeholder communications.
Potential challenges include ensuring map accuracy and current data, managing cultural sensitivities around regional representation, addressing language barriers with Chinese place names, and maintaining visual clarity when projecting complex geographical details. These presentation considerations require careful attention to audience familiarity with regional geography, appropriate zoom levels for readability, and contextual information that enhances understanding, ultimately delivering effective geographical communication.
**INPUT**: What color schemes are most effective when designing a map-focused PowerPoint template? **OUTPUT**: Effective map-focused PowerPoint color schemes include high-contrast combinations like navy and gold, muted earth tones, monochromatic blues or greens, and professional grayscale with accent colors. These approaches enhance readability by ensuring clear geographic boundaries, improving data visualization through strategic color coding, and maintaining audience engagement, with many organizations finding that balanced palettes ultimately deliver better comprehension and more impactful presentations. **Word count: 60 words**
Different industries utilize Wuhan geographic map templates for logistics route optimization, market expansion analysis, demographic studies, and regional business planning across sectors like manufacturing, healthcare, and retail. Companies leverage these templates to visualize supply chain networks, identify growth opportunities, analyze competitor locations, and present regional strategies to stakeholders, ultimately delivering clearer geographic insights and more informed decision-making for Wuhan-focused business operations.
Effective data visualizations for Wuhan map templates include heat maps, choropleth maps, demographic overlays, infrastructure markers, and economic indicators through color-coded districts or pin-point locations. These visualizations enable businesses to display population density, industrial zones, transportation networks, and commercial opportunities across Wuhan's districts, ultimately delivering strategic insights for market analysis, logistics planning, and regional expansion decisions.
Scale and detail in a Wuhan China Map PowerPoint template are crucial for delivering clear geographical context, accurate spatial relationships, and targeted regional focus that enhances audience comprehension. These elements enable presenters to seamlessly navigate between city-wide overviews and district-specific insights, with many businesses finding that properly scaled maps significantly improve stakeholder engagement and decision-making processes.
Animations and transitions enhance map storytelling by revealing data progressively, guiding audience attention through districts, and creating visual narratives that highlight Wuhan's development timeline or demographic patterns. These dynamic elements enable presenters to control information flow, emphasize key locations like the Yangtze River confluence or industrial zones, and transform static geographic data into compelling business cases, ultimately delivering more engaging presentations and improved audience retention across sectors like urban planning, logistics, and market analysis.
When designing geographical PowerPoint presentations, key audience considerations include cultural sensitivity, context relevance, visual accessibility, and regional familiarity levels. These factors influence design choices through appropriate color schemes, detailed zoom levels, and contextual information depth, with many presenters finding that incorporating local perspectives and avoiding potentially sensitive political boundaries ultimately delivers more engaging and respectful presentations across diverse audiences.
Wuhan's strategic location at the confluence of the Yangtze and Han rivers has shaped PowerPoint templates that emphasize connectivity, transportation networks, and industrial clusters. These geographical presentations highlight the city's role as a central China logistics hub, with many business templates featuring river commerce, railway intersections, and manufacturing zones, ultimately delivering compelling narratives about infrastructure advantages and economic accessibility.
Software tools ideal for enhancing Wuhan China maps in PowerPoint include Adobe Illustrator, Canva Pro, Lucidchart, ArcGIS Online, and PowerPoint's built-in SmartArt features. These platforms streamline map customization by enabling vector editing, data visualization overlays, and interactive elements, with many organizations finding that strategic combinations deliver more engaging presentations and clearer geographic storytelling.
A Wuhan map template enhances geography education by facilitating lessons on Chinese urbanization, regional demographics, economic development patterns, transportation networks, and cultural landmarks through visual learning approaches. These templates enable educators to create interactive presentations covering population density studies, infrastructure analysis, and comparative city planning, while students engage with real-world geographic concepts, ultimately delivering enhanced spatial understanding and cultural awareness.
Unique presentation themes include urban development showcases, supply chain logistics networks, cultural heritage tourism, smart city initiatives, and regional economic analysis presentations. These templates enhance business presentations by highlighting geographic connectivity, demographic insights, and strategic positioning, with many organizations finding that location-based visuals streamline complex data communication and strengthen audience engagement.
-
SlideTeam is a great place for PPT templates. They have many templates on a single topic. It has made my life a lot easier.
-
You can rely on SlideTeam whenever you run out of designs for your presentation. Thank you so much SlideTeam!