


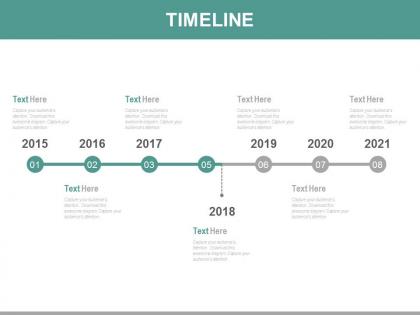
Year based linear timeline for sales analysis powerpoint slides




Try Before you Buy Download Free Sample Product
 Impress Your
 Audience
 100%
100% Editable
 Save Hours
 of Time


Presenting finance management and strategic marketing PPT Slide for the effective and efficient management of your funds. In this diagram, we have explained financial management strategy through a timeline view. This power point template diagram has been crafted with the graphic of the year based linear timeline diagram. This PPT icon slide contains the concept of sales strategy and analysis representation, Professionals can use this PPT diagram for business and finance related presentations. This eight stage process is conceptualized across a horizontal axis, where years 2015 to 2021 are included, though these can easily be edited in a PowerPoint software. This PPT slide is dedicated to delivering nothing but excellence, our design is here to take you through the complex steps of your business process and break it down into easier steps. Click the download button and "Year Based Linear Timeline for Sales Analysis PowerPoint Slides" is here at your service for a magnificent experience, get started now. Compose your thoughts with our Year Based Linear Timeline For Sales Analysis Powerpoint Slides. The audience will feel in harmony with them.
People who downloaded this PowerPoint presentation also viewed the following :
Year based linear timeline for sales analysis powerpoint slides with all 4 slides:
Our Year Based Linear Timeline For Sales Analysis Powerpoint Slides aim to be culturally aware. You will acquire cross border acceptability.


FAQs for Year based linear timeline for sales
Key milestones include lead generation, initial contact, qualification, needs assessment, proposal presentation, negotiation, contract signing, and post-sale follow-up. These checkpoints streamline sales processes by identifying bottlenecks, measuring conversion rates, and optimizing resource allocation, with many organizations finding that systematic milestone tracking ultimately delivers faster deal closure and enhanced sales team performance.
Sales timeline analysis helps identify customer behavior trends by tracking purchase patterns, seasonal fluctuations, buying cycle lengths, engagement touchpoints, and conversion rates across different time periods. Through detailed temporal mapping, organizations can predict demand cycles, optimize inventory management, and personalize marketing campaigns, with many retail and e-commerce businesses finding that timeline insights ultimately enhance customer experiences and drive revenue growth.
**INPUT**: What tools are most effective for creating visual sales timelines? **OUTPUT**: Effective sales timeline visualization tools include Gantt chart software, CRM platforms with pipeline tracking, project management applications, presentation software with timeline templates, and specialized sales analytics dashboards. These technologies streamline prospect tracking, milestone management, and performance analysis, with many sales organizations finding that visual timelines enhance forecasting accuracy, improve team coordination, and ultimately accelerate deal closure rates.
Historical sales data enhances future sales predictions by identifying seasonal patterns, customer behavior trends, and market cycles that inform accurate forecasting models. Through predictive analytics, businesses can anticipate demand fluctuations, optimize inventory management, and adjust sales strategies proactively, with many retail and manufacturing companies finding that data-driven predictions reduce costs while improving customer satisfaction.
Seasonal variation significantly impacts sales timeline analysis by revealing recurring patterns, identifying peak and low-demand periods, optimizing inventory management, and enabling strategic resource allocation. Through comprehensive seasonal analysis, retailers, hospitality businesses, and consumer goods companies can predict demand fluctuations, adjust marketing campaigns accordingly, and enhance operational efficiency, ultimately delivering better customer experiences and competitive advantage.
Sales representatives can use timeline analysis to identify peak conversion periods, track prospect engagement patterns, analyze deal velocity across different customer segments, and pinpoint bottlenecks in their sales funnel. Through this data-driven approach, representatives optimize follow-up timing, prioritize high-probability leads, and adjust their outreach strategies based on historical performance patterns, ultimately accelerating deal closure and improving conversion rates.
Common pitfalls include relying on incomplete data, ignoring seasonal variations, focusing solely on individual deals rather than pipeline patterns, and failing to account for external market factors. These oversights can lead organizations to make misguided forecasting decisions, misallocate resources, and miss critical bottlenecks, ultimately undermining sales performance and strategic planning accuracy.
Sales timelines can be integrated with marketing efforts through shared lead scoring systems, synchronized content delivery schedules, coordinated campaign calendars, and unified customer journey mapping. This strategic alignment enables marketing teams to deliver targeted content at optimal pipeline stages, while sales receives qualified leads with proper nurturing context, ultimately reducing conversion times and improving close rates across organizations.
Key metrics for sales timeline analysis include conversion rates at each stage, average deal size, sales cycle length, pipeline velocity, and time-to-close ratios. These metrics enable organizations to identify bottlenecks, optimize resource allocation, and accelerate deal progression, with many sales teams finding that tracking stage-specific conversion rates ultimately delivers faster closures and improved forecasting accuracy.
Different industries approach sales timeline analysis by adapting methodologies to their unique cycles, with financial services focusing on quarterly performance metrics, manufacturing analyzing seasonal procurement patterns, and retail tracking promotional campaign effectiveness. These sector-specific approaches enable organizations to optimize resource allocation, forecast revenue more accurately, and enhance competitive positioning, ultimately delivering faster deal closures and improved customer experiences.
**INPUT**: What are the best practices for presenting sales analysis findings to stakeholders? **OUTPUT**: Best practices include creating clear executive summaries, using visual dashboards with key metrics, tailoring insights to each stakeholder group, and focusing on actionable recommendations rather than raw data. These approaches enhance decision-making by highlighting trends, performance gaps, and growth opportunities, with many sales organizations finding that structured presentations drive faster strategic responses and improved revenue outcomes. **Word count**: 58 words
Customer feedback significantly influences sales timelines by revealing bottlenecks, identifying decision-maker concerns, and highlighting product-market fit issues that can accelerate or extend cycles. Through systematic feedback collection, sales teams streamline proposal processes, address objections proactively, and customize approaches for different buyer personas, ultimately reducing average deal closure times while improving conversion rates and customer satisfaction.
Visual elements that enhance sales timeline clarity include color-coded phases, milestone markers, progress indicators, performance metrics overlays, and clear date labels. These design components streamline complex sales data by highlighting critical deadlines, distinguishing pipeline stages, and showcasing achievement patterns, with many organizations finding that strategic visual hierarchy ultimately delivers faster decision-making and improved sales forecasting accuracy.
Sales timelines should be updated weekly or bi-weekly to maintain accuracy and responsiveness, with major revisions occurring monthly or quarterly based on market conditions, seasonal patterns, and performance data. Through regular updates, sales teams can adjust forecasting models, realign resource allocation, and identify pipeline bottlenecks early, ultimately delivering improved conversion rates and more predictable revenue outcomes.
Sales timeline analysis supports territory planning by identifying seasonal patterns, peak performance periods, customer buying cycles, and resource allocation opportunities across different regions. Through historical data examination, sales managers can strategically assign territories, optimize timing for campaigns and product launches, and allocate personnel more effectively, ultimately enhancing regional performance and competitive positioning.
-
Nice and innovative design.
-
Awesomely designed templates, Easy to understand.