

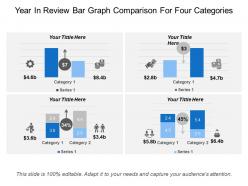
Year in review bar graph comparison for four categories





Try Before you Buy Download Free Sample Product
 Impress Your
Audience
 100%
Editable
 Save Hours
of Time


Give a good break down with our Year In Review Bar Graph Comparison For Four Categories. Every detail gets duly emphasized.
Presenting this set of slides with name - Year In Review Bar Graph Comparison For Four Categories. This is a four stage process. The stages in this process are Year In Review, Year Highlights, Countdowns.
People who downloaded this PowerPoint presentation also viewed the following :
Year in review bar graph comparison for four categories with all 5 slides:
Build faith in the future with our Year In Review Bar Graph Comparison For Four Categories. Do away with any cause for gloom.


Most Relevant Reviews
-
Use of different colors is good. It's simple and attractive.
-
Very unique and reliable designs.