Yes no decision tree with different branches

Rating:
90%
Yes no decision tree with different branches
Slide 1 of 5
Favourites Favourites

Try Before you Buy Download Free Sample Product

Audience Impress Your
Audience
Editable 100%
Editable
Time Save Hours
of Time
The Biggest Sale is ending soon in
0
0
:
0
0
:
0
0
Rating:
90%
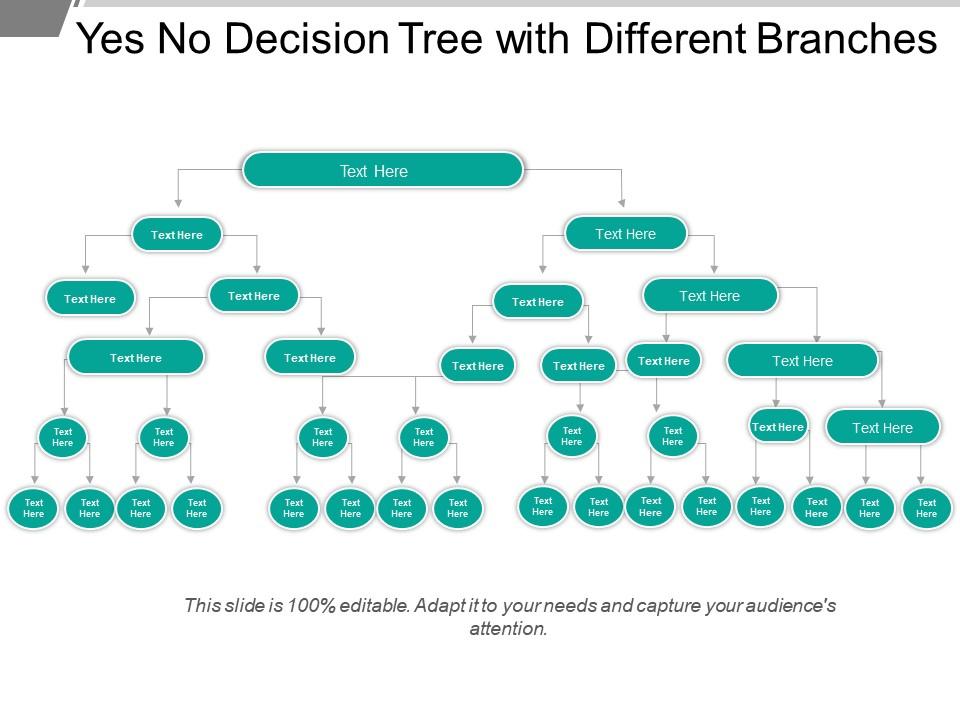
Presenting this set of slides with name - Yes No Decision Tree With Different Branches. This is a five stage process. The stages in this process are Yes No Decision Tree, Decision Making, Decision Model.

People who downloaded this PowerPoint presentation also viewed the following :

FAQs for Yes no decision tree

Decision trees include root nodes, internal nodes, leaf nodes, branches, and splitting criteria that form a hierarchical structure for decision-making. These components interact by processing data through branches based on specific conditions, with internal nodes evaluating criteria and leaf nodes delivering final outcomes, ultimately enabling organizations to automate complex decisions and streamline analytical processes.

Decision trees handle continuous data by finding optimal split points through threshold values, while categorical data uses exact value matching or subset groupings. Through automated algorithms, these trees evaluate thousands of potential splits, determining whether loan applicants exceed income thresholds or match specific job categories, ultimately delivering precise segmentation and improved prediction accuracy across diverse datasets.

Decision trees offer interpretability, handle mixed data types, require minimal preprocessing, and provide clear decision paths, while disadvantages include overfitting tendencies, instability with small data changes, and bias toward features with more levels. These characteristics make them particularly valuable in healthcare diagnostics and financial risk assessment, where transparency is crucial, with many organizations finding that ensemble methods like random forests effectively minimize the limitations while preserving interpretability.

Pruning improves decision tree performance by removing branches that don't significantly enhance predictive accuracy, reducing overfitting, and creating more generalizable models. This process streamlines complexity while maintaining essential decision pathways, with many organizations finding that pruned trees deliver faster processing speeds, clearer interpretability, and more reliable outcomes across diverse datasets.

Decision trees are preferred when interpretability is crucial, data contains mixed variable types, or when stakeholders need transparent decision-making processes. Organizations in healthcare, finance, and regulatory industries particularly value decision trees for credit approvals, medical diagnoses, and compliance assessments, as these models clearly show reasoning paths while delivering accurate predictions with minimal data preprocessing requirements.

Feature selection significantly enhances decision tree effectiveness by reducing overfitting, improving accuracy, and minimizing computational complexity through elimination of irrelevant or redundant variables. Strategic feature selection enables faster model training, clearer interpretability, and better generalization across datasets, with organizations in finance and healthcare finding that focused feature sets deliver more reliable predictions and actionable insights.

Entropy measures the impurity or randomness in a dataset, serving as the foundation for determining optimal splits when constructing decision trees. By calculating information gain through entropy reduction, decision tree algorithms like ID3 and C4.5 systematically select attributes that maximize data purity at each node, ultimately delivering more accurate classifications and streamlined decision-making processes across various analytical applications.

Decision trees perform regression analysis by predicting continuous numerical values rather than discrete categories, using techniques like mean squared error for splitting criteria and averaging target values at leaf nodes. Unlike classification trees that output class probabilities or categories, regression trees deliver precise numerical predictions, making them valuable for forecasting sales, estimating prices, or predicting resource demands across industries like finance and manufacturing.

Decision tree performance can be evaluated using accuracy, precision, recall, F1-score, and AUC-ROC for classification tasks, while regression trees utilize RMSE, MAE, and R-squared metrics. These evaluation methods enable organizations across healthcare, finance, and retail to assess model reliability, optimize predictive capabilities, and enhance decision-making processes, ultimately delivering improved operational efficiency and competitive advantage.

**INPUT**: How does the depth of a decision tree affect its accuracy and interpretability? **OUTPUT**: Decision tree depth creates a strategic trade-off between accuracy and interpretability, with deeper trees capturing complex patterns but becoming harder to understand and prone to overfitting. Shallow trees enhance interpretability for stakeholders in healthcare, finance, and retail sectors, while controlled depth optimization enables organizations to balance predictive performance with business transparency, ultimately delivering actionable insights that decision-makers can trust and implement effectively. [Word count: 60]

Ensemble methods like Random Forests and Boosting combine multiple decision trees to enhance predictive accuracy, reduce overfitting, and improve model reliability through strategic aggregation techniques. Random Forests build numerous trees using different data subsets, while Boosting sequentially corrects errors, with financial institutions and healthcare organizations finding these approaches deliver significantly better fraud detection and diagnostic accuracy than single trees.

Decision trees can be visualized through flowcharts, tree diagrams, interactive dashboards, heat maps, and node-link representations that clearly display branching logic and outcomes. These visualization approaches streamline complex decision pathways by highlighting key variables, probability distributions, and final recommendations, with many organizations finding that visual formats enhance stakeholder comprehension and accelerate strategic decision-making processes.

Common challenges include overfitting to training data, difficulty handling continuous variables, instability with small data changes, bias toward features with more levels, and poor performance with linear relationships. These limitations often lead organizations in finance, healthcare, and retail to combine decision trees with ensemble methods like random forests, ultimately delivering more robust predictions while maintaining the interpretability advantage.

Overfitting in decision trees can be detected through cross-validation, monitoring training versus validation accuracy gaps, and analyzing unusually deep trees with excessive branches. Mitigation strategies include pruning techniques, setting minimum samples per leaf, limiting tree depth, and using ensemble methods like Random Forest, with many data scientists finding that combining pre-pruning parameters with post-pruning validation delivers optimal model generalization.

Ethical considerations in decision tree implementation include data bias mitigation, algorithmic transparency, privacy protection, fairness across demographic groups, and accountability for automated outcomes. These frameworks help organizations navigate regulatory compliance, stakeholder trust, and responsible AI deployment by ensuring explainable logic, minimizing discriminatory patterns, and maintaining human oversight, ultimately delivering ethical decision-making processes while preserving competitive advantage.

Ratings and Reviews

90% of 100
Review Form
Write a review
Most Relevant Reviews
  1. 80%

    by Corey Patterson

    The content is very helpful from business point of view.
  2. 100%

    by James Lee

    Very unique, user-friendly presentation interface.

2 Item(s)

per page: