

Analytics framework strategic value portfolio design technology opportunities




Try Before you Buy Download Free Sample Product
 Impress Your
 Audience
 100%
100% Editable
 Save Hours
 of Time


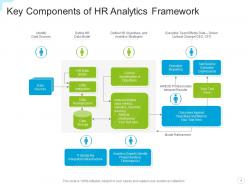
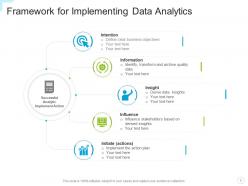
Every organization needs a strategy for where it wants to be in the future and how it plans to get there. Without a strategy, decision-making is left to chance and your business will likely not reach its full potential. A critical part of any strategic plan is laying out the organization's goals and objectives, which can then be used to create a roadmap of activities needed to achieve these goals. The SlideTeam data analytics powerpoint templates can help you design a winning framework for your business. You can also use these templates to capitalize on technology opportunities and get insights into the value of your portfolio. With our templates, you’ll have everything you need to make the most of your data and drive success for your business. So download our templates today.
People who downloaded this PowerPoint presentation also viewed the following :
Analytics framework strategic value portfolio design technology opportunities with all 12 slides:
Use our Analytics Framework Strategic Value Portfolio Design Technology Opportunities to effectively help you save your valuable time. They are readymade to fit into any presentation structure.
FAQs for Analytics framework strategic value portfolio
Okay so you'll need five main things: data collection, storage, processing power, visualization tools, and governance rules. Most people totally ignore the governance part but honestly it's make-or-break stuff. Without clear rules on data quality and who can access what, your dashboards look pretty but nobody believes them. I'd start by figuring out what data you actually have vs what you need - sounds backwards but trust me. Then work from there based on what decisions you're trying to make. Storage and processing are more straightforward once you nail down the governance piece first.
So basically, a framework is like having a recipe while traditional methods are just winging it. You get consistent processes that work across your whole company instead of everyone doing their own random thing with different tools. The cool part? You can actually build on what you've done before rather than reinventing the wheel every single time. Plus your results are comparable between projects, which honestly saves so much headache down the road. Traditional analysis gets messy fast - teams work in silos and there's no real quality control. Frameworks give you those standardized workflows and data governance stuff that actually scales.
Think of data governance as the foundation everything else sits on. Your analytics are only as good as the data feeding them, and I've watched companies make terrible decisions because their data was a mess. You need someone owning each dataset's quality - like, actually responsible for it. Set up clear rules about who accesses what and how everything gets collected. Document your current sources first (boring but necessary). Create standard definitions so everyone's speaking the same language. Honestly, the security piece can't wait either - one breach and you're toast. Start small with one clean dataset and build from there.
Honestly, data quality checks need to be baked in from the start - don't wait until later. Validate everything at ingestion: completeness, accuracy, consistency. I've watched perfectly designed dashboards fall apart because the underlying data was complete trash. Set up automated monitoring to catch weird anomalies. Also establish who actually owns each dataset (this gets messy fast without clear ownership). The biggest thing though? Create feedback loops. When your analysts find issues, they need a fast way to report back so you can fix the source. Otherwise you're just playing whack-a-mole with bad data forever.
First thing - map out what data you've already got flowing around. API-first integration works best since it keeps everything flexible. Seriously, set up error handling right away or you'll hate yourself later. Don't duplicate data everywhere, it gets pricey and syncing becomes a total mess. Roll things out piece by piece instead of trying to do everything at once. Test in staging first (duh). Here's the big one though - figure out data governance early. Like, who owns what data and how it should look? Skip this step and you'll be cleaning up garbage for months. Trust me, I've been there.
Okay so first figure out what metrics actually matter for your industry - like patient stuff for healthcare, inventory turnover for retail, whatever. Most of these frameworks let you customize way more than you'd think. Start by mapping where your data lives (POS, CRM, those IoT things) then build dashboards that match how your team actually works. Oh and if you're in finance or healthcare, don't forget the compliance nightmare stuff. Honestly though? Just pilot it with one department first. Get their honest feedback, then roll it out to everyone else. Way less messy that way.
Okay so first thing - grab Airflow or Prefect for moving data around. Store everything in Snowflake or BigQuery. SQL plus Python is still the winning combo for analytics, though honestly dbt has kinda taken over the transformation game (and for good reason). Tableau or Looker will handle your viz needs. Oh and definitely set up monitoring - DataDog works great or just build custom alerts. Trust me, you'll thank yourself when stuff inevitably breaks at 2am. Pick one from each bucket and expand later.
So basically, an analytics framework stops you from drowning in useless reports nobody actually reads. It's like having a roadmap for turning data into real decisions instead of just fancy charts. Everyone knows which metrics actually matter and who does what with the insights. Honestly, most companies skip this step and wonder why their data team just produces pretty dashboards that collect dust. The trick is connecting everything back to your actual business goals - not just whatever's easy to measure. Start with your top 3 decisions that need data backing them, then build around those. Way easier than trying to boil the ocean.
Honestly, you need to track two main buckets here - how people are actually using the thing and whether it's moving the needle business-wise. Adoption rates, time-to-insight, data quality scores - the usual suspects. Are teams faster now? Getting better results? That's half the battle. The other half is ROI and whether you're hitting those strategic goals you probably wrote down months ago (lol). Decision-making speed matters too. Don't go crazy with metrics though - pick 3-5 that match what you were trying to solve originally, then build from there.
So basically, an analytics framework is like having your kitchen already set up before you cook - you're not hunting around for a spatula while your food burns. It handles all the messy data pipeline work and gives you proper tools for deploying models. Without one? You'll waste forever fixing data quality problems instead of actually building anything cool. I learned this the hard way at my last job - we spent months just getting different systems to talk to each other. Start by checking what infrastructure you've already got lying around.
Ugh, data quality will drive you nuts - everything's scattered across random systems and half of it's garbage. Getting teams to agree on which metrics actually matter? Good luck with that. People hate changing how they track stuff, even when their current way sucks. Tool selection is weirdly hard too because you don't want to build some crazy complicated thing. Oh, and don't get me started on inconsistent data formats. Honestly though, pick one simple thing to fix first. Get that nailed down, then tackle the rest. Way less overwhelming that way.
Okay so visualization tools are basically magic for turning boring spreadsheets into something people actually want to look at. Charts and dashboards make patterns pop out instantly - way better than scrolling through endless rows of numbers. Your stakeholders won't zone out anymore when you're presenting findings. Plus you'll catch trends and weird outliers that would've been buried in the raw data. Honestly, I've seen projects get approved just because the visuals looked convincing. Figure out what decisions you need to make first, then pick charts that highlight exactly those insights.
Look, don't just throw dashboards at people and hope for the best. Train your teams on the tools first - otherwise they'll ignore everything. Build "data check-ins" into regular meetings where decisions actually get backed up by numbers. Leadership has to walk the walk here, not just give speeches about being data-driven (I've watched that backfire so many times). Celebrate when data leads to real wins. Set up self-service options too so people can dig around themselves. Oh, and remove whatever's making it annoying for people to actually access the data. Leading by example is huge.
Honestly, you've got to bake feedback right into your analytics from the start. Check in regularly - not just staring at numbers, but actually asking if your metrics still matter. So many teams I know get trapped using the same old KPIs for years! Let stakeholders call out when something feels weird or priorities change. Short bursts work better than marathon reviews, trust me. Write down what's working and what sucks, then tweak your whole setup every quarter or so. Think of your analytics like any other product that needs constant fixing based on what people actually tell you.
Dude, analytics frameworks are seriously worth it. You get real-time data on how people actually use your stuff instead of just guessing why they bounce. Track the most important user actions first - that's where I'd start anyway. The cool part? You can spot exactly where people get frustrated and fix those pain points way faster. Plus you'll see which features they actually love (sometimes it's not what you think). Short bursts of data beat long reports nobody reads. Once you're tracking behavior patterns, personalizing experiences becomes so much easier. Total game-changer for engagement.
-
Commendable slides with attractive designs. Extremely pleased with the fact that they are easy to modify. Great work!
-
Designs have enough space to add content.
-
Great quality slides in rapid time.
-
Appreciate the research and its presentable format.
-
The content is very helpful from business point of view.
-
Best Representation of topics, really appreciable.
-
Out of the box and creative design.
-
Qualitative and comprehensive slides.