

Data Analytics Powerpoint Presentation Slides




Try Before you Buy Download Free Sample Product
 Impress Your
 Audience
 100%
100% Editable
 Save Hours
 of Time


Analyze raw data in order to make a conclusion by utilizing this Data Analytics PowerPoint Presentation Slides. Take the assistance of this data mining PPT visuals to mention the importance of social media and interactive platforms like Google, Facebook, Twitter, Youtube, Instagram. Showcase how cloud computing provides real-time information and on-demand insights with the help of data source PPT graphics. Take the aid of this big data management PPT templates to showcase the web services which provide free and quick information insights to everyone. You can also, discuss how big data is generated from the internet of things with the help of data transformation PPT graphics. You can also highlight the popular databases such as MS Access, DB2, Oracle, SQL, which can provide for the interaction of insights that are used to drive business profits. Display various data warehouse applications that help in the analysis of transactional data. Discuss the sources of big data such as legacy documents, media, cloud, social influencers, etc. Help your business operate more effectively by downloading this data integration PowerPoint Presentation
People who downloaded this PowerPoint presentation also viewed the following :
Content of this Powerpoint Presentation
Data may come across as a technical term to us but the truth is we analyze and process data in our everyday lives. From calculating the right amount of ingredients for a cup of coffee to giving ETAs of your assigned tasks, data analytics is part and parcel of our lives. Organizations employ data analytics tools to anticipate and achieve success.Identifying the right sources of data is a primary requirement for delivering accurate results and should be conveyed to teams handling these channels. For this, you need Data Analytics PowerPoint Presentation Slides to highlight the key sources of data procurement so that the relevant team will know whom to approach.
Our complete deck on Data Analytics PowerPoint Presentation Slides offers a visually appealing way to guide your organization in identifying the correct sources of data. This data will then be sent to processing and analysis to generate valuable key insights. The data analysis thus obtained will be a fair, all-encompassing, and a reliable source of information for the organization to refer to and draw conclusions from. On this note, let’s explore the best presentation slides of this PPT Template to give you an idea of the investment you will make upon downloading it.
Template 1: Media
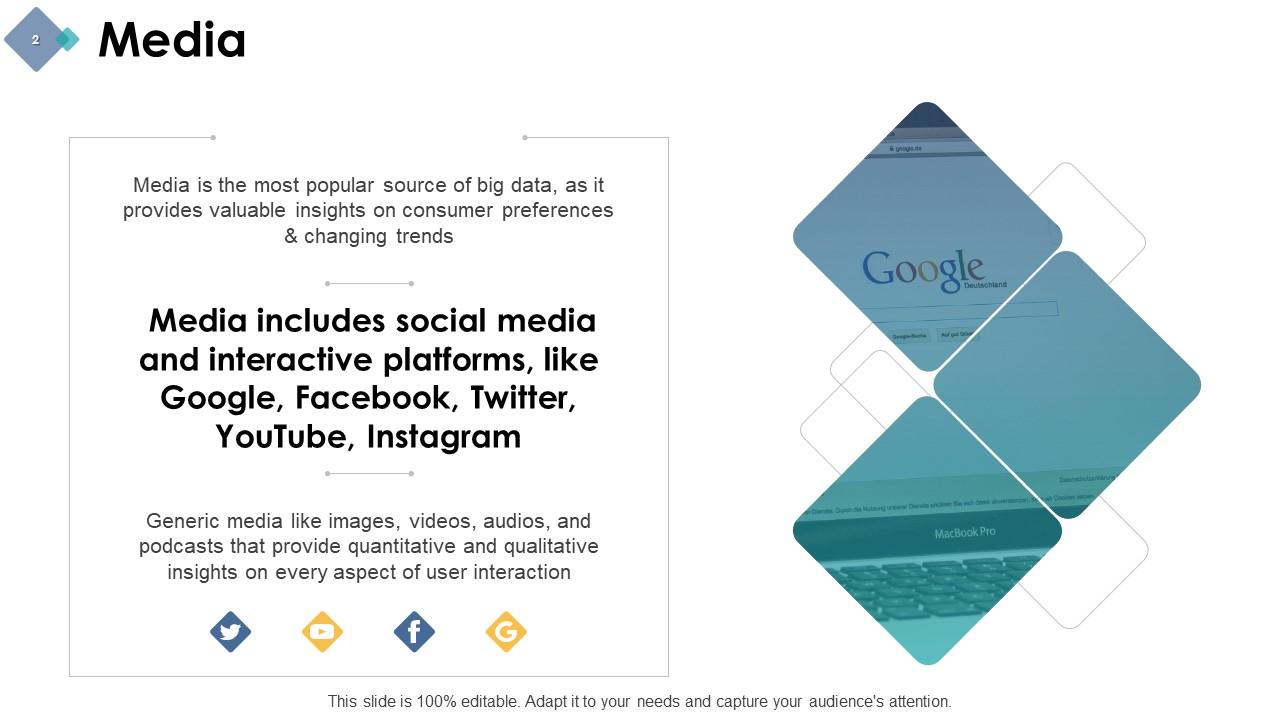
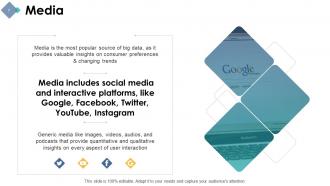
This slide of our data analytics PowerPoint Presentation will highlight the importance of media as a hub of data to draw insights on customer preferences and changing trends. It will emphasize on the importance of social media channels and interactive platforms in being a rich source of qualitative and quantitative data. By highlighting media as a reliable source of data, this PPT Template will guide teams in employing this important channel for data analytics.
Template 2: Cloud
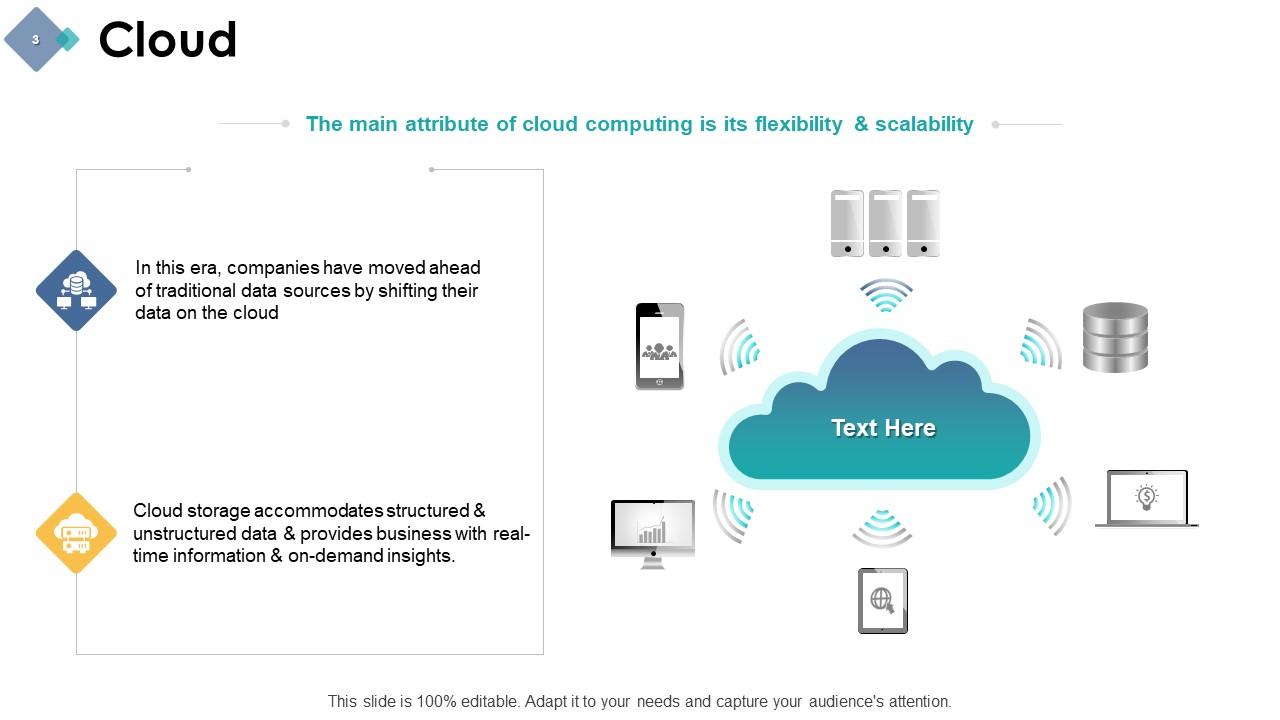
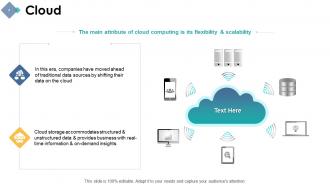
With cloud-based products and services gaining significance,, it would be a missed opportunity not to leverage them for sourcing data. Highlight the significance of cloud computing, emphasizing its ability to accommodate large data files and its accessibility, making it a vast reservoir of data, on this PowerPoint slide. Highlight the fact that using cloud files to fetch data will widen the scope of information collected from sources thus validating your analysis more.
Template 3: Web
Utilize the world wide web as a data resource to guide your business strategies and assessments and point this important reservoir of data with this PPT Template. Your team can explore the plethora of researches, statistics, and news shared by verified portals to back up your data analytics report. The visuals and icons will add to the effect of conveying its importance.
Template 4: Internet of Things
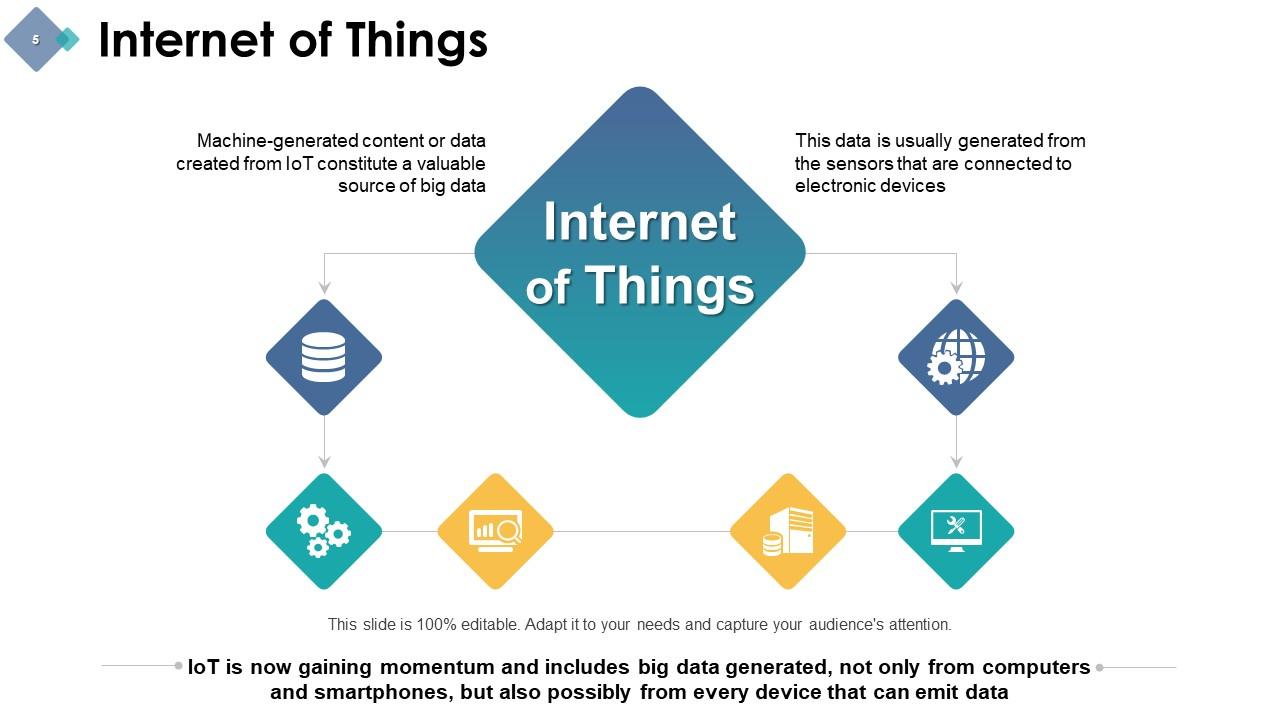
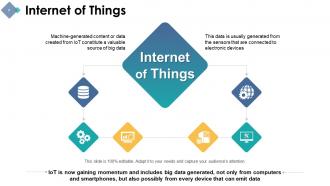
The contribution of IoT in data analytics will always be top-tier and you can convey the same with content-ready visuals of this PPT Design. Sensors, software, and other devices that gather first-hand data add credibility to subsequent analysis. performed on it thereof can be pointed out during the discussion and elaboration. During discussion, highlight the IoT devices utilized in your organization, showcasing their role in data analytics and organizational benefits. This PPT Layout facilitates easy awareness building.
Template 5: Databases
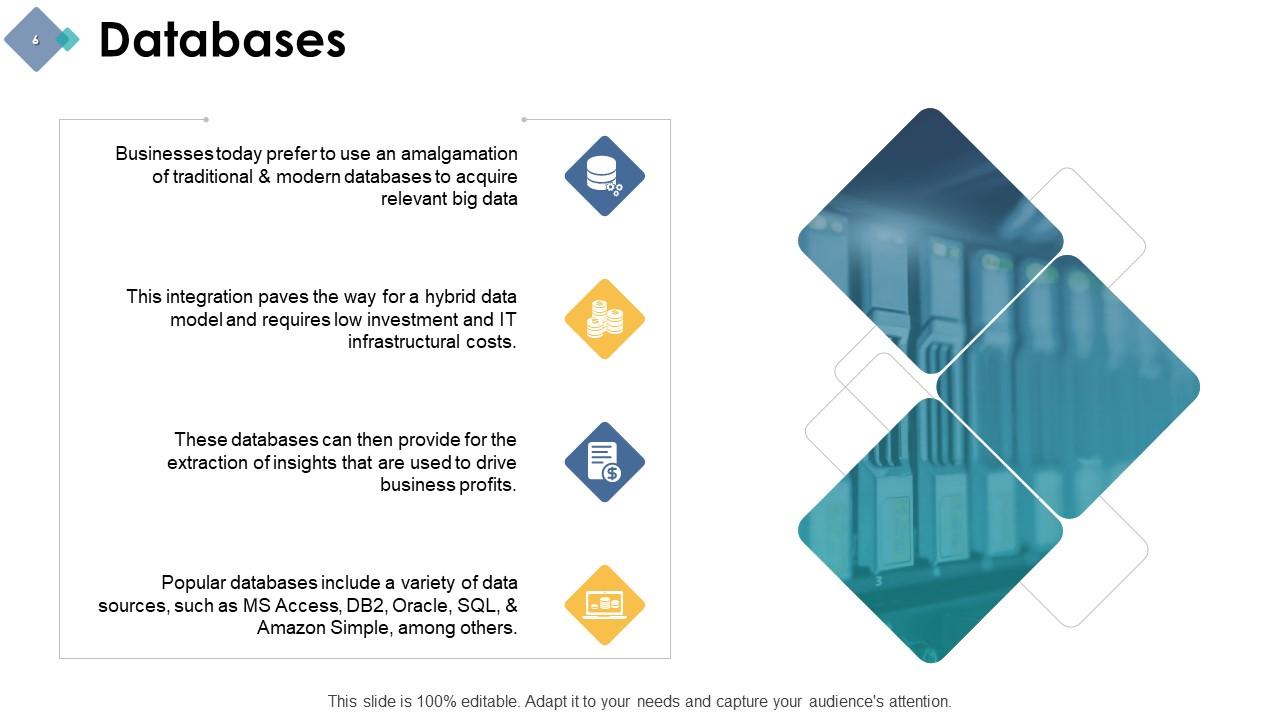
Data is an asset and your organization can rely on previously collected, stored, and processed data that will guide future analysis. Emphasize the importance of your organizational database in guiding future analytics work. Use this slide to encourage data governance of the database and direct teams to rely on it for future data analytics.
Template 6: Social Network Profiles
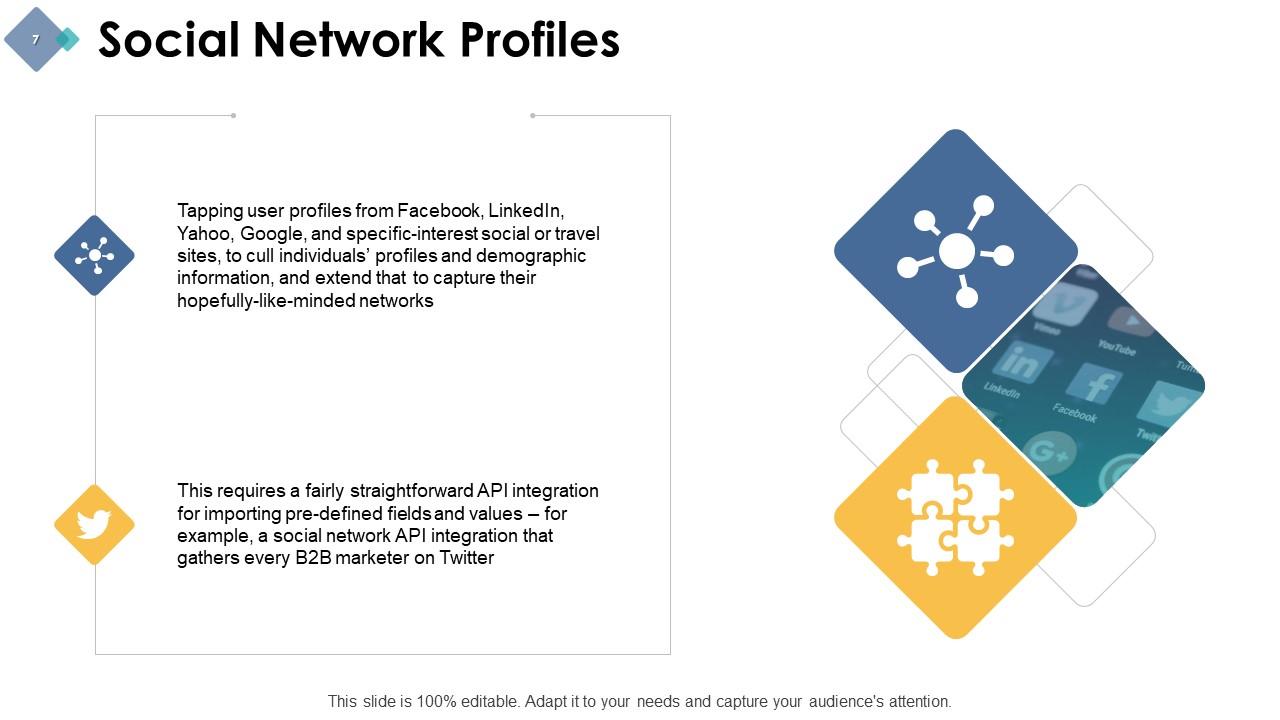
In this PPT Slide, you can focus on social media profiles being contributors to the data sent for analysis and drawing important conclusions. By examining profiles on platforms such as Twitter, Facebook, LinkedIn etc, garther a list of like-minded prospective clients to study their interests and to devise your business strategies. Using API integration, you can analyze relevant B2B marketers and tailor pitches accordingly.
Template 7: Social influencers
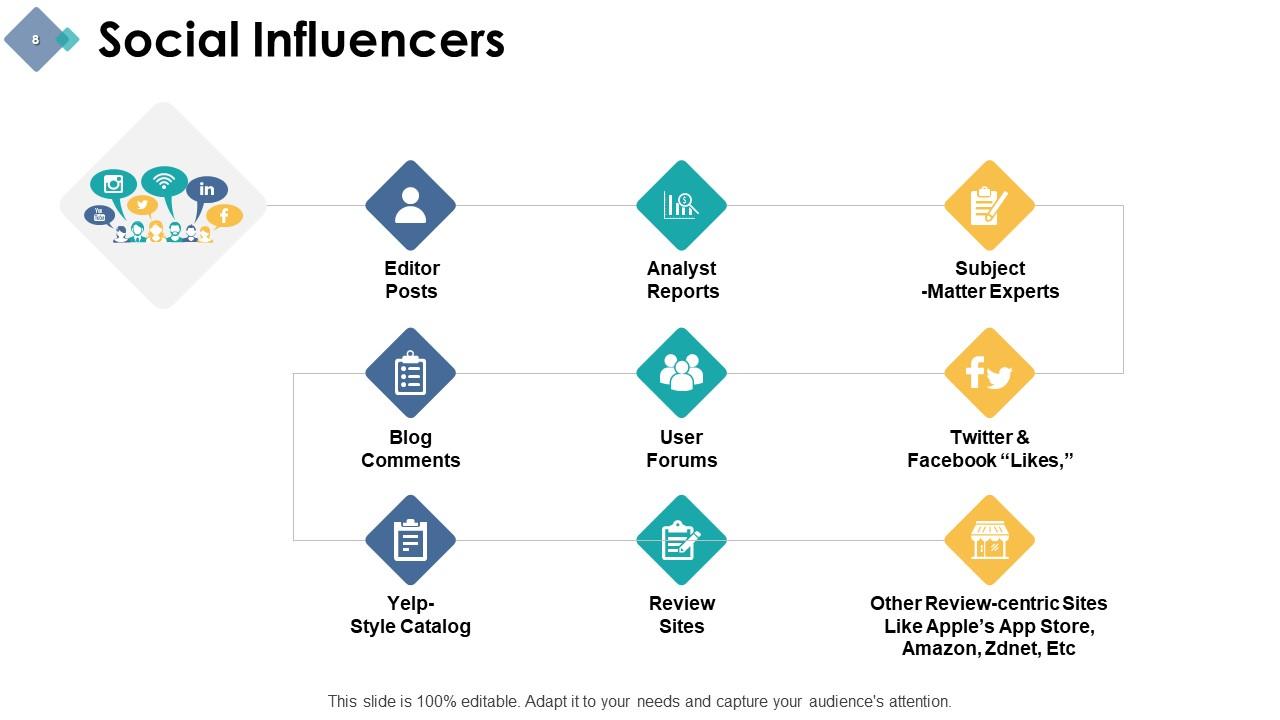
Social influencers can serve as another source of data collection allowing you to tap into the potential of influencer marketing and use their profiles to collect important data, customer preferences, and inclinations. Blog posts, user forums, review sites, are some of the ways you can get the most out of influencer marketing contributing to your companies data analytics.
Template 8: Activity-Generated Data
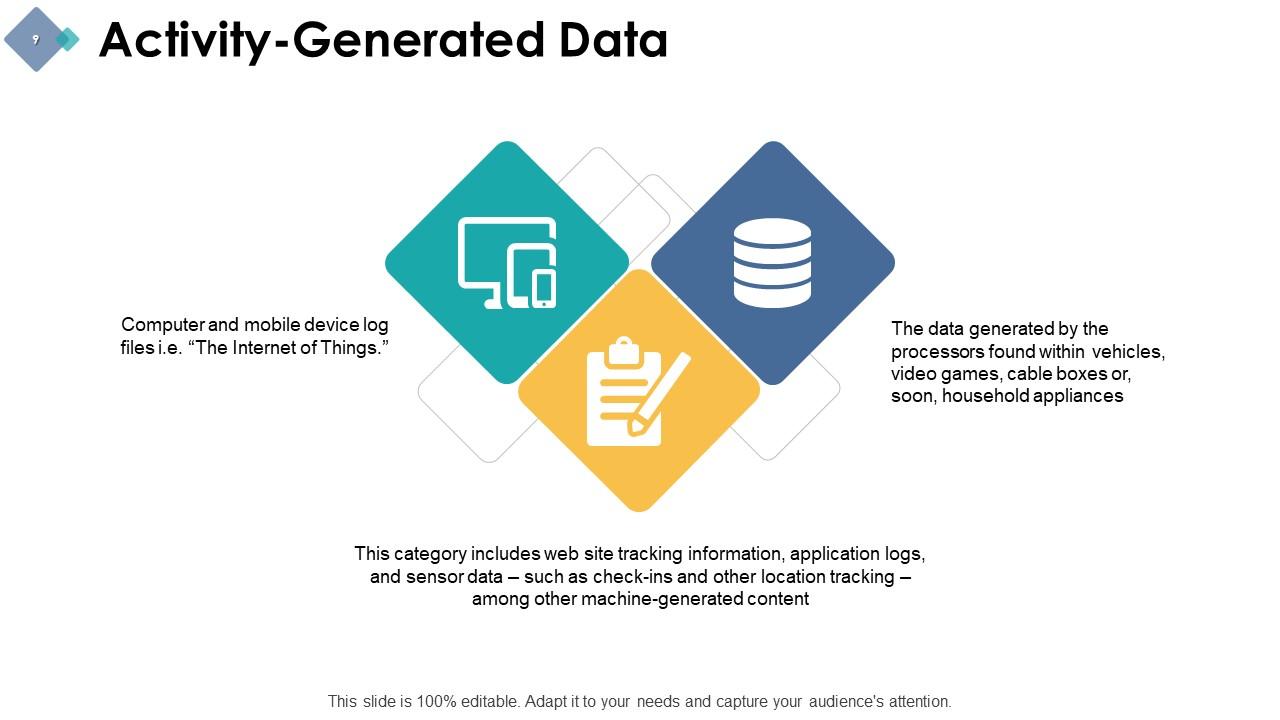
Businesses can acquire additional data for processing and analysis by tracking usage, generating feedback forms, and enquiring about customer preferences. IoT embedded in applications, products, or as a part of service contract will help companies study the interest and usage of their services and products by clients. This will also be the basis of a reliable data analytics report for your company.
Template 9: Big Data Sources
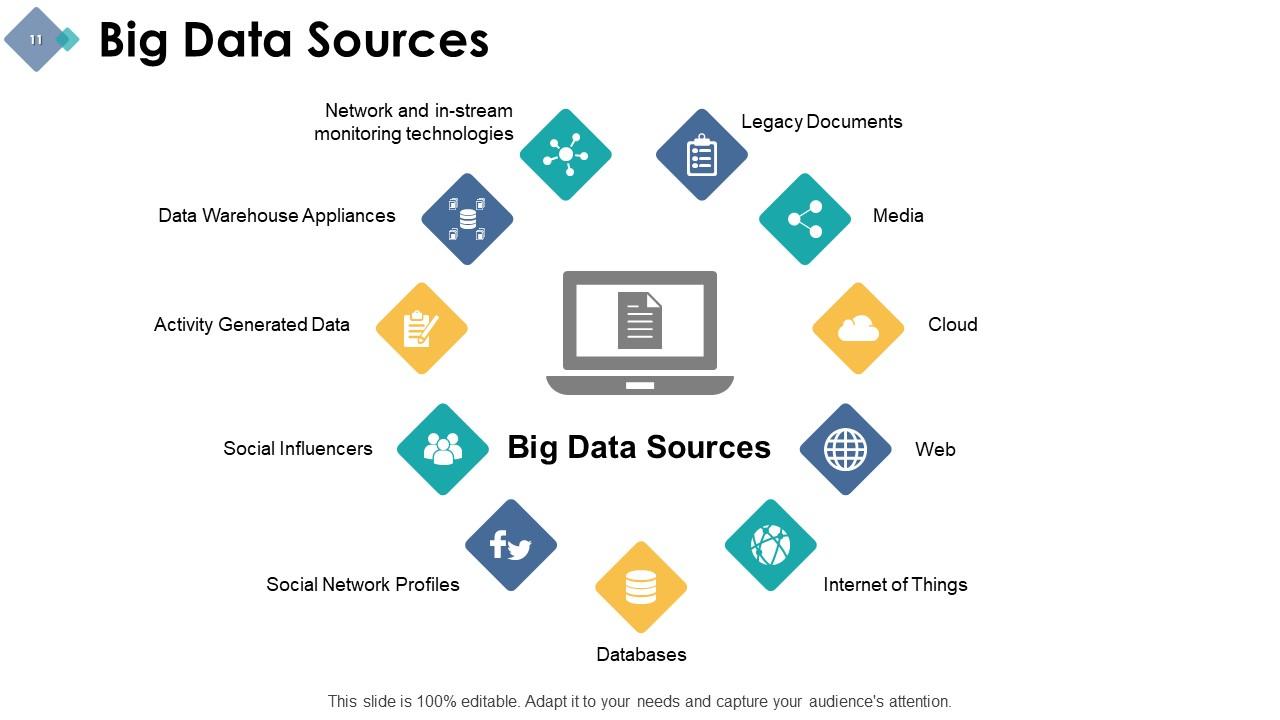
In this slide, you can summarize all the previously discussed big data sources and add to this list. Icons will support the easy visualization of the sources being discussed and you can edit the list as all of our slides are 100% editable and customizable.
Template 10: Network and In-Stream Monitoring Technologies
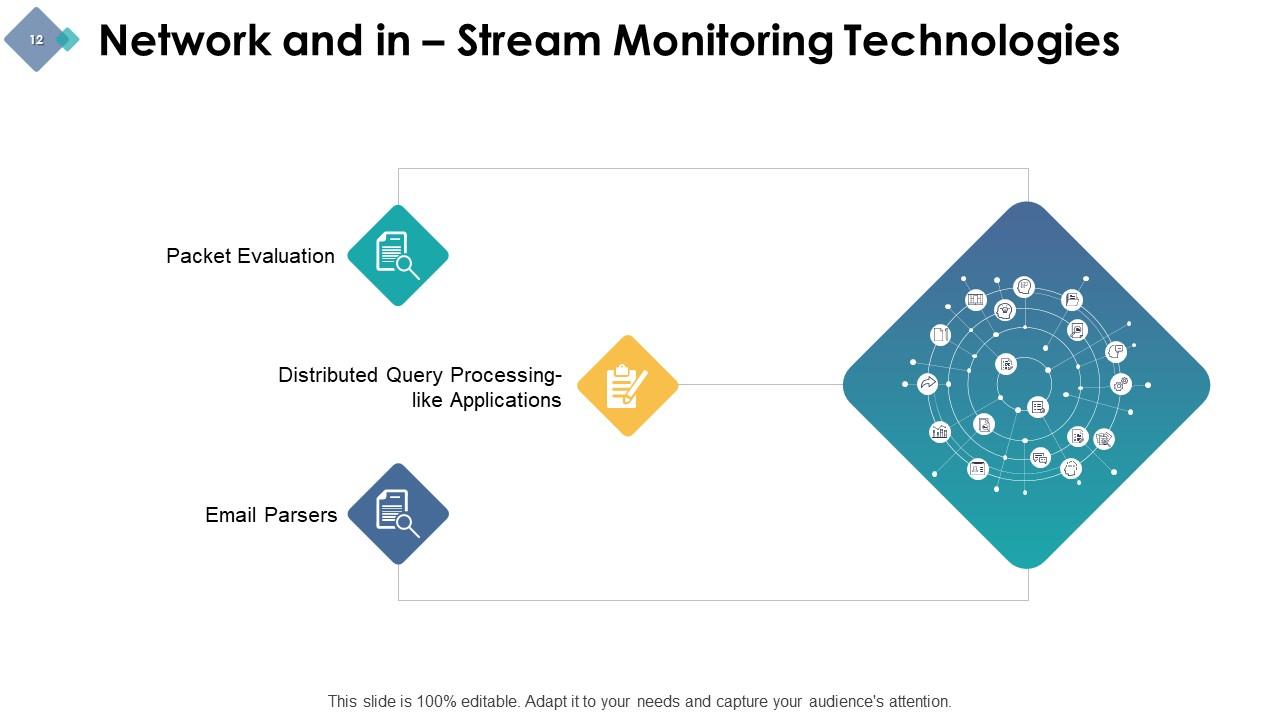
This PPT Slide will help you highlight the importance of network and in-stream monitoring technologies in data analytics. In this presentation design you can talk about how monitoring the incoming and outgoing traffic on a computer network will help users fetch data that will be helpful in data analytics. You can point to the need for specialized hardware and/or software in collecting this important data. So, download it now!
Know Your Tools
As you help your audience know the tools for data analysis, you can assign respective teams to be vigilant about collecting the big data. Discuss the process of collecting data and how to preserve it for long without depleting its value or tampering it. Use this carefully collected data to power your analytic reports and this journey will begin effectively upon downloading this comprehensive training material titled Data Analytics PowerPoint Presentation.
Data Analytics Powerpoint Presentation Slides with all 20 slides:
Use our Data Analytics Powerpoint Presentation Slides to effectively help you save your valuable time. They are readymade to fit into any presentation structure.
-
Data Analytics
-
Media
-
Cloud
-
Web
-
Internet of Things
-
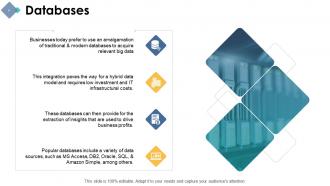
Databases
-
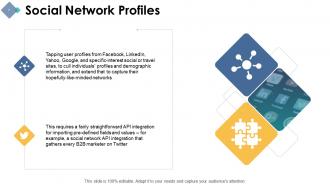
Social Network Profiles
-
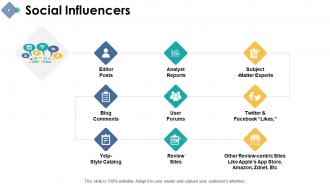
Social Influencers
-
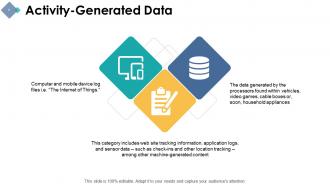
Activity Generated Data
-
Data Warehouse Appliances
-
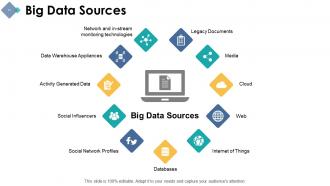
Big Data Sources
-
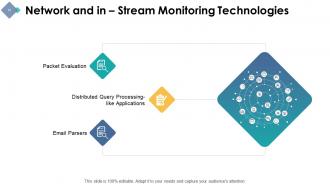
Network and in Stream Monitoring Technologies
-
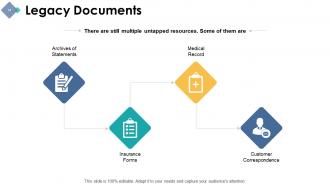
Legacy Documents
-
Data Analytics Icons Slide
-

Additional Slides
-
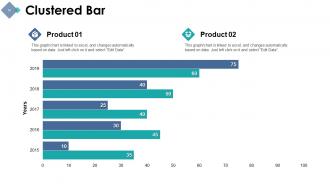
Clustered Bar
-
Our Mission
-
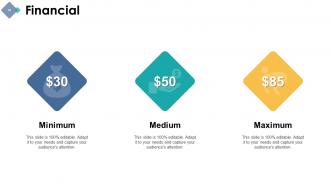
Financial
-
About Us
-
Thank You Slide
FAQs for Data Analytics
So descriptive analytics is basically looking at what already happened - your sales reports, dashboards, that kind of stuff. Pretty straightforward. Predictive takes that old data and tries to guess what's coming next, like which customers might bail or how much inventory you'll need. Prescriptive is where it gets interesting though - it actually tells you what to do about those predictions. Most companies (including mine honestly) just stick with the basic reporting stuff, but you're missing out if you stop there. I'd say get your regular reports solid first, then you can start playing with the prediction models. Way more exciting than staring at last month's numbers again.
Stop collecting data just to have it - you need stories that actually help you make decisions. Figure out what you're really trying to solve first. Why are people leaving? What products make us the most money? Then dig into your analytics to find patterns and trends. The cool part is predicting what'll happen before you commit to something big. Most companies have tons of data but can't figure out what it means (kinda wild honestly). Build dashboards that show metrics you can actually act on, not just pretty numbers that make executives feel good but don't tell you what to do next.
Honestly, charts and graphs are lifesavers when you're dealing with messy data. Your brain processes visuals way faster than scanning through endless spreadsheet rows - which is torture, let's be real. A good scatter plot or heatmap will show you patterns and weird outliers that you'd never catch otherwise. I always throw my data into different chart types first before doing anything else. It's like giving your data a translator so your brain can actually make sense of it. You'll be shocked at what becomes obvious once you visualize it properly.
Okay so first things first - get proper consent and don't be sketchy about what you're doing with people's data. Transparency is huge here. Only grab what you actually need though, because honestly? Most teams just collect everything and then figure it out later, which is terrible. Watch out for bias in your models too - some algorithms can really screw over certain groups without you realizing it. Anonymize stuff whenever you can, and for the love of god, have a plan for how long you're keeping this data. Quick gut check: would you be cool with someone doing this exact same thing with your personal info?
So ML basically takes your regular data analysis and puts it on steroids. You know how you spend hours looking for patterns in spreadsheets? These algorithms do that automatically and keep learning as new data comes in. Way faster than doing it by hand, obviously. Plus you can throw massive datasets at it and find weird connections between things that normal stats would totally miss. I'd honestly just start with something simple though - like whatever boring analysis you do every week, see if you can automate that first. Don't go crazy right away.
Honestly, just focus on SQL and Python first - they'll handle like 80% of what you'll actually be doing day-to-day. SQL's absolutely essential since you're constantly pulling data from databases. Python with pandas and numpy is crazy versatile too, goes from data cleaning all the way to machine learning stuff. R's fantastic for stats work but man, the learning curve is brutal compared to Python. For dashboards, Tableau and Power BI are your best bet - they make pretty visualizations that don't confuse the hell out of executives. Those two languages I mentioned play well with everything else anyway.
Yeah totally! Google Analytics is your best friend for website stuff, and honestly don't sleep on Google Sheets - it's way more powerful than people give it credit for. Most social platforms have free analytics built right in too. Excel can actually handle a surprising amount if you already have it. Oh and if you want something fancier, Tableau Public won't cost you anything. There are paid options like Zoho Analytics for like $20/month, but I'd start with the free stuff first. Just work with whatever data you've got and go from there.
Ugh, you're gonna hate the data format mess - every system stores dates differently and field names never match up. Quality issues are brutal too. Missing values everywhere, duplicates galore, and don't even get me started on schema mismatches. Security restrictions will block you from half the systems you need (because of course they will). Honestly though, map out all your sources first before you touch anything else. Build decent ETL processes early or you'll be fixing garbage data forever. Different structures trying to mesh together is just painful otherwise.
Garbage data in means garbage insights out, no matter how fancy your analysis gets. I learned this the hard way when a whole project got wrecked because we missed some duplicate records early on. Missing values, outdated info, wonky entries - they'll torpedo your results before you even know what hit you. Honestly, stakeholders will stop trusting anything you show them once they catch wind of bad data. The worst part? You might not realize how screwed your dataset is until you're mid-presentation. Just bite the bullet and clean everything upfront - future you will thank you.
Think of data governance as your safety net for analytics - it keeps your data accurate and consistent from start to finish. You don't want to build analysis on garbage data, trust me on that one. Good governance means clear ownership, quality standards, and access controls so your team stops questioning whether the numbers are legit. Plus it prevents those super awkward meetings where marketing and sales have totally different figures for the same thing. I'd start small - document your data sources and set up basic quality checks. Even baby steps will save you massive headaches later.
You know how frustrating it is waiting for reports that are already outdated? Real-time analytics fixes that completely. Retail stores can change prices instantly, catch inventory issues before shelves go empty, and hit customers with personalized deals while they're actually shopping. Healthcare is where it gets really impressive though - continuous patient monitoring means catching problems way before they turn into emergencies. Honestly, I think healthcare applications are cooler than retail ones. The key is finding that one process where waiting even a few hours is costing you real money.
Honestly, skip the vanity metrics - they won't impress anyone who matters. Go for stuff that actually moves the needle: how fast you're making decisions now, revenue from data-backed choices, operational cost savings. ROI calculations are a pain but worth tracking. User adoption rates tell you if people actually use your dashboards (shocking how many don't). Data quality scores matter too since garbage in = garbage out. Pick 3-4 metrics your leadership cares about most. You can always add more later, but start simple.
Dude, sentiment analysis is like reading your customers' minds through their complaints and posts. You can catch problems before they explode everywhere. Happy customers? Perfect time to pitch them upgrades. Pissed off ones need totally different treatment though. I started with my Google reviews and Twitter mentions - honestly was kinda eye-opening how much people actually share their feelings online. Once you see the patterns, you can time your emails better and tweak your messaging. It's basically a cheat code for knowing when someone's ready to buy vs when they're about to bail.
So you're gonna need both tech skills and people skills, honestly. Start with SQL and Excel - they're like your bread and butter. Python or R comes next, pick whichever feels less scary. Stats matter too, but don't stress about being perfect - just get comfortable with the basics like regression and testing hypotheses. Oh, and everyone's obsessed with Tableau these days for making pretty charts. The soft stuff is huge though. Being curious and actually enjoying solving puzzles will get you way further than just knowing code. I'd probably focus on SQL first since you'll use it constantly.
Look at your sales history and what people search for online - that's where patterns hide. Social media tells you what's buzzing too. Track who clicks what on your site and when they actually buy stuff. Honestly, your CRM probably has way more useful data than you realize. You can group customers by how they act, then send them different messages. The predictive stuff is pretty neat - it'll show you trends before they fully hit. Start with what you already have: website analytics, social channels, customer data. Much easier than starting from scratch.
-
Commendable slides with attractive designs. Extremely pleased with the fact that they are easy to modify. Great work!
-
Attractive design and informative presentation.
-
Great experience, I would definitely use your services further.
-
Amazing product with appealing content and design.