


Data Management Analysis Powerpoint Presentation Slide


Try Before you Buy Download Free Sample Product
 Impress Your
 Audience
Editable
of Time


Who doesn't want to excel in their business and wish for convenient time-saving solutions? We understand you have been looking too. Ergo, we bring you Data management analysis Powerpoint presentation slide for a hassle-free approach to change management and data analysis. These PPT's are braced with high-quality designs and images and build to deliver the best. Now all your agenda's related to big data representation can be stored in a plane format to be bestowed on your team. Text boxes used here allows you to present your views on the respective topic. Big data representation is shown here in intriguing modern styles as well as traditional ways. High-quality images and concepts used here make this design appropriate for your next big presentation. The perfect composite of graphics and contextualized text-based figures sets this presentation apart and it can help your hard work payout and allow you to embellish your plans free of space restraints. Click download and get ahead. Be acclaimed as a good judge with our Data Management Analysis Powerpoint Presentation Slide. Impress folks by your insistence on being fair.
People who downloaded this PowerPoint presentation also viewed the following :
Content of this Powerpoint Presentation
Slide 1: This slide introduces Data Management Analysis. State Your Company Name and begin.
Slide 2: This is an Agenda slide. Present your agendas here.
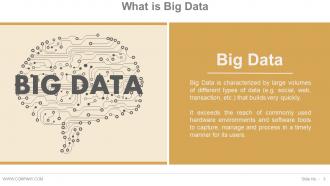
Slide 3: This slide presents What is Big Data and its definition.
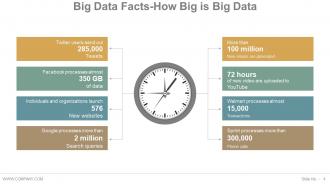
Slide 4: This slide showcases Big Data Facts-How Big is Big Data and so on.
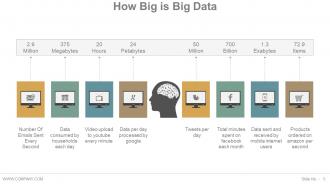
Slide 5: This slide shows How Big is Big Data in terms of data, numbers etc.
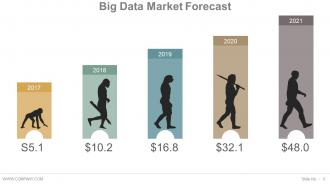
Slide 6: This slide showcases Big Data Market Forecast in a creative graph form.
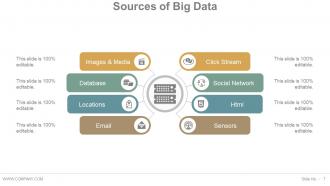
Slide 7: This slide showcases Sources of Big Data. The sources are- Images & Media, Database, Locations, Email, Click Stream, Social Network, Html. Sensors
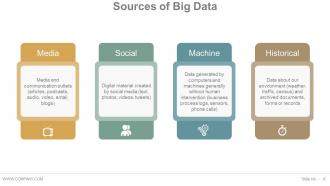
Slide 8: This slide showcases Sources of Big Data categorized as- Media (Media and communication outlets (articles, podcasts, audio, video, email, blogs)} Machine (Data generated by computers and machines generally without human intervention (business process logs, sensors, phone calls)} Social {Digital material created by social media (text, photos, videos, tweets)} Historical (Data about our environment (weather, traffic, census) and archived documents, forms or records)
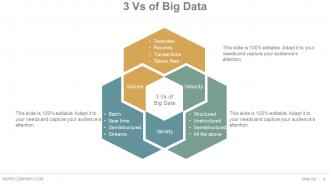
Slide 9: This slide showcases 3 Vs Of Big Data. They are- Variety, Velocity, Volume.
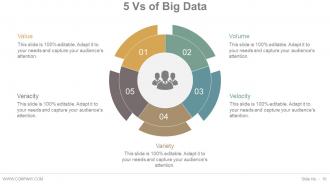
Slide 10: This slide presents 5 Vs Of Big Data Variety, Volume, Velocity, Value, Veracity.
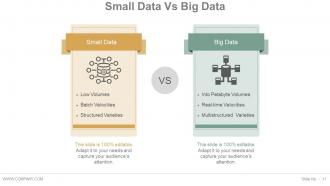
Slide 11: This slide showcase comparison Small Data (Low Volumes, Batch Velocities, Structured Varieties) Vs Big Data (Into Petabyte Volumes, Real-time Velocities, Multistructured Varieties).
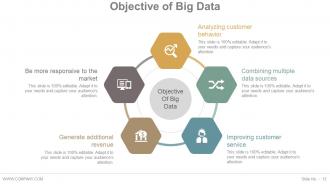
Slide 12: This slide presents Objective of Big Data- Analyzing customer behavior, Combining multiple data sources, Improving customer service, Generate additional revenue.
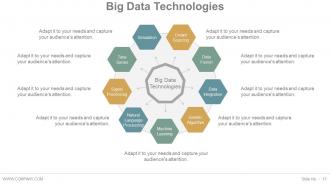
Slide 13: This slide showcases Big Data Technologies. Listed ones are- Data Integration, Genetic Algorithm, Machine Learning, Natural Language, Processing, Signal Processing, Time Series, Simulation, Crowd Sourcing, Data Fusion.
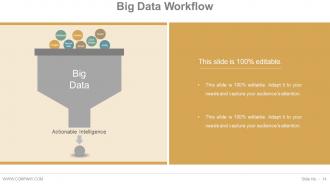
Slide 14: This slide presents Big Data Workflow in funnel form displaying- Actionable intelligence, Email, Click stream, Html, Social, Location, Database, Sensor data, Images.
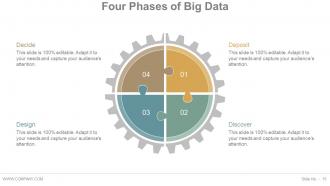
Slide 15: This slide showcases Four Phases of Big Data- Deposit, Discover, Decide, Design.
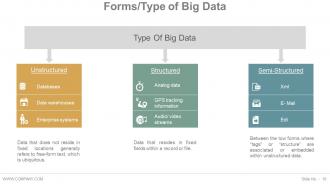
Slide 16: This slide shows Forms/Type of Big Data- Semi-Structured, Unstructured, Structured.
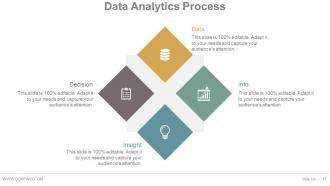
Slide 17: This slide presents Data Analytics Process divided into- Data, Info, Decision, Insight.
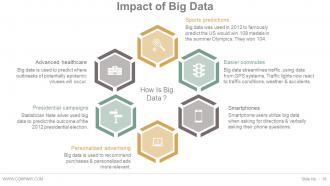
Slide 18: This slide showcases Impact of Big Data. Examples are- Sports predictions, Easier commutes, Smartphones, Advanced healthcare, Presidential campaigns, Personalized advertising.
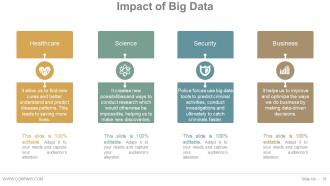
Slide 19: This slide shows Impact of Big Data used in- Healthcare, Science, Security, Business.
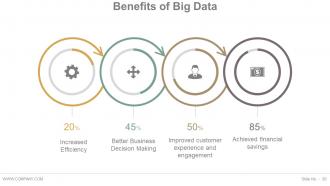
Slide 20: This slide showcases Benefits of Big Data such as- Increased Efficiency, Better Business Decision Making, Improved customer experience and engagement, Achieved financial savings.
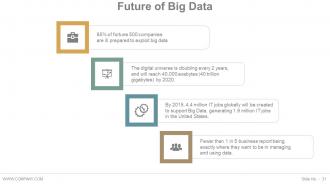
Slide 21: This slide presents Future of Big Data. You can add your own examples here.
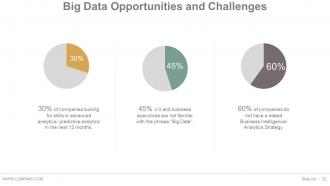
Slide 22: This slide displays Big Data Opportunities and Challenges. State them here.
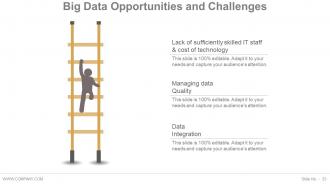
Slide 23: This slide displays Big Data Opportunities and Challenges. Examples given are- Lack Of Sufficiently Skilled IT Staff & Cost Of Technology, Managing Data Quality, Integration.
Slide 24: This slide is titled Additional Slides to move forward.
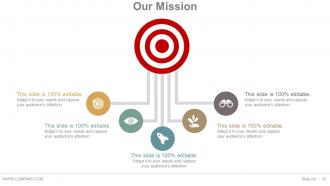
Slide 25: This is Our Mission slide. State it here.
Slide 26: This is Our Team slide with names, designation and image boxes.
Slide 27: This is an About Us slide. State company/team specifications here.
Slide 28: This is Our Goal slide. State them here.
Slide 29: This slide shows Comparison in horizontal bars.
Slide 30: This is a Financial score graph. State finanacial aspects here.
Slide 31: This slide shows Quotes. Display your message, beliefs etc. here.
Slide 32: This slide displays Dashboard with imagery and text boxes.
Slide 33: This slide showcases Location in world map image. Show global presence, growth etc. here.
Slide 34: This is a Timeline slide. Show milestones, achievements, growth etc. here.
Slide 35: This is a Post It slide to mark reminders, events etc.
Slide 36: This is a Newspaper image slide to show events, highlights etc.
Slide 37: This is a Puzzle image slide to show information, specification etc.
Slide 38: This slide showcases Target. State them here.
Slide 39: This is a Circular image slide. State information, specification etc. here.
Slide 40: This is a Venn diagram slide. State information, specification etc. here.
Slide 41: This is a Mind map slide. State information, specification etc. here.
Slide 42: This is a Matrix slide. State information, specification etc. here.
Slide 43: This is a Lego Box slide. State information, specification etc. here.
Slide 44: This is a Silhouettes slide. State audience/market related information, specification etc. here.
Slide 45: This is a Hierarchy slide. State information, specification etc. here.
Slide 46: This is a Bulb Or Idea slide. State information, specification, innovative aspects etc. here.
Slide 47: This is a Magnifying glass image slide. State information, specification, scoping aspects etc. here.
Slide 48: This is a Bar graph slide to show product/entity information, specification, comparison etc. here.
Slide 49: This is a Funnel image slide. State information, specification, funneling aspect/nuances here.
Slide 50: This is a Thank You slide with Address # street number, city, state, Contact Numbers, Email Address.
Data Management Analysis Powerpoint Presentation Slide with all 50 slides:
Use our Data Management Analysis Powerpoint Presentation Slide to effectively help you save your valuable time. They are readymade to fit into any presentation structure.


FAQs for Data Management Analysis
Look, it's basically four things you gotta nail: data quality, security, access, and governance. Garbage in, garbage out - so your data needs to be clean and consistent from day one. Security's obvious - lock down sensitive stuff with proper controls and encryption. Make sure the right people can actually find and use what they need (good organization helps tons here). Oh, and governance sounds boring but someone has to own each dataset and set clear policies. Honestly, I'd start by just auditing what you've got now and figuring out who's responsible for what.
Honestly, most quality issues start with messy input processes, so get your data governance sorted first. Set validation rules at entry points and run audits regularly to catch weird stuff. Manual cleanup is soul-crushing - definitely grab some cleansing tools. Your team needs consistent entry standards too, plus feedback loops for quick error flagging. Oh, and this isn't a one-and-done thing. Data quality is ongoing maintenance. I'd audit your current sources first and figure out what's causing the biggest headaches. Trust me on the tools thing though - your sanity will thank you later.
So data governance is your company's rulebook for handling data - who gets access, quality standards, where stuff comes from, how long you keep it. Without it, you're basically just shuffling garbage around at lightning speed (learned that one the hard way). It's what stops all your data management from turning into total chaos. My advice? Start by figuring out who actually owns what data in your current mess of systems. That'll show you the biggest problems right away. Trust me, skip this step and nothing else will work properly.
First thing - get your backup strategy sorted, everything else builds from there. Use clear naming conventions so you're not googling what "usr_tmp_v2" means at midnight (been there). Regular backups are obvious but people still skip them. Put your hot data on fast storage, dump the old stuff somewhere cheap. Oh and index properly - slow queries will drive you insane. Set up monitoring for storage and performance so problems don't sneak up on you. Document your schemas too, future you will actually appreciate it. Start simple, then optimize once you've got the basics locked down.
First figure out which rules actually hit your business - GDPR for EU stuff, CCPA if you've got California customers, whatever else applies. Build everything around those from day one because retrofitting is honestly such a nightmare (learned that the hard way). You'll want solid data retention rules and access controls that actually work. Document how you handle data - like, everything. Oh and make sure you can delete customer info when they ask, that's huge. Having an incident plan ready saves your butt when things go sideways.
Honestly, start with what you actually need right now instead of trying to learn everything. SQL is a must - PostgreSQL or MySQL both work great. Cloud stuff like AWS or Azure will save you so much headache with scaling, trust me on that one. Python's probably your best bet for data processing, though R works too if you're into stats. For bigger datasets you'll eventually need something like Spark. Oh and MongoDB or Cassandra if you're dealing with unstructured data. Tableau makes pretty charts but there's tons of visualization options. The whole ecosystem moves crazy fast anyway, so don't stress about being perfect.
Honestly, clean data saves you so much time it's not even funny. You can spot trends fast, catch problems early, and actually trust your gut checks instead of second-guessing everything. Messy data though? Total nightmare. I've watched entire teams burn weeks on analysis just to find out their source data was completely wrong from day one. Pretty brutal. When everything's organized upfront, your reports actually mean something. Otherwise you're just making expensive guesses based on garbage numbers, which... yeah, never ends well.
Start by mapping out what data sources you're actually dealing with - sounds boring but you'll thank me later. ETL processes are your best friend for getting everything into the same format before dumping it in your warehouse. APIs work great if you need real-time connections between systems. There's also data virtualization, which is pretty slick - lets you query multiple sources without moving anything around. Honestly though? Pick whatever method fits your budget and what your team can actually handle. Don't try to boil the ocean right away. Focus on your most critical data relationships first and build from there.
Dude, metadata is what saves you from going insane later. Picture file folders with labels - except way better because it tells you what your data actually is, where it came from, when someone made it. I've watched entire teams spend weeks staring at mystery datasets like "wtf is this supposed to be?" Super painful to watch. Good metadata cuts through all that mess. Helps with compliance stuff too. Just start with your most important datasets - don't try to document everything at once or you'll burn out.
Honestly, data quality becomes a nightmare first - everything gets messy and you're stuck with duplicate records everywhere. Infrastructure costs will eat your budget alive if you're not careful about storage optimization. Finding decent data architects? Good luck with that, the talent pool is tiny right now. Your teams probably aren't talking to each other either, so you end up with these weird disconnected systems. I'd say audit what you actually have before throwing more tech at the problem. Costs spiral fast when you're just adding complexity on top of chaos.
Dude, automation is a game changer - it cuts manual data work by like 60-80%. All that tedious stuff like collecting data, cleaning it up, checking for errors? It just runs itself. No more babysitting spreadsheets or hunting down duplicates (seriously, life's too short). Your processes become way more consistent too since there's no human error creeping in. The best part though? You actually get to do interesting analysis instead of boring prep work. Oh, and don't try to automate everything at once - that's overwhelming. Just pick one annoying weekly task and start there.
Okay so here's the thing - your data management basically controls everything you can do with analytics. If your data's messy, inconsistent, or stored everywhere, you'll waste like 80% of your time just cleaning and searching instead of actually analyzing. Honestly drives me crazy when I see teams skip this step. Good governance and proper schemas make everything so much faster and more reliable. Otherwise you get that garbage-in-garbage-out situation, and then stakeholders stop trusting your work. Get the foundation solid first - trust me, it saves tons of headaches down the road.
Honestly, it totally depends on what industry you're in. Healthcare and finance are brutal - HIPAA compliance will drive you nuts, and don't get me started on financial audit trails. Tech companies? They just want to move fast and break things, so they're way more relaxed about governance. Manufacturing cares about supply chain stuff and operational data. Retail's all about customer analytics and keeping track of inventory. Look at what other companies in your space are doing first, then figure out what actually makes sense for your situation. No point copying someone else's playbook if it doesn't fit.
Dude, your customers won't wait for outdated info - neither will your competition. Processing data instantly means you're reacting to what's actually happening instead of last week's news. Netflix suggestions, catching fraud, supply chain stuff - it all needs that speed. Honestly, the companies dominating right now? They're the ones jumping on market shifts and customer changes as they occur, not waiting for some report on Tuesday. Figure out where your data delays are literally costing you money and fix those first.
First thing - get data out of your analytics team's hands and into everyone else's. Dashboards, self-service tools, whatever works. Train people on the basics too (they're smarter than they realize, just need someone to show them). Your leadership has to actually USE this stuff visibly or nobody else will bother. Oh, and celebrate when teams make data-driven calls, even tiny ones. That stuff spreads. I'd probably start with one simple process where you can show quick wins - builds momentum way faster than trying to change everything at once.
-
Visually stunning presentation, love the content.
-
Visually stunning presentation, love the content.
-
Presentation Design is very nice, good work with the content as well.