"In God we trust; all others must bring data." – W. Edwards Deming.
These witty words from Deming are enough to highlight how important data is in today's world! Businesses and researchers are always on the hunt to harvest insights from the data they have collected via surveys and research. But there is a problem here. The sheer volume of data is extremely high today. On top of that, businesses always face challenges when dealing with diverse data. All these troubles can hamper the entire process.
The worst part is that the challenge lies in collecting and analyzing that data. Users often have to sift through extensive survey responses and seek patterns and narratives within numbers. But the job is easier said than done! But don't worry, we have a solution!
Our experts at SlideTeam have prepared multiple content-ready and 100% editable templates that can fix these issues. Without the right tools, valuable insights remain hidden, and data fails to inform business strategy as it should. These templates are designed based on real-life scenarios. This can help businesses and strategists target specific problems related to Survey Data Analysis and take proactive steps to manage the issue.
From constructing survey questions to deriving insights, each slide provides a comprehensive understanding of and utilization of data. Our templates are visually appealing and engaging. Vivid colors, simple layouts, and eye-catching icons make these templates even more effective and visually appealing. With these tools, users can distil vast quantities of information into clear, actionable insights and ensure that every datum counts towards a smarter, data-informed future. So, let's take a look at these templates one by one.
Template 1: Survey Data Analysis PowerPoint PPT Template Bundles
This 17-slide bundle can prove to be a great tool for survey data analysis. It offers a detailed dissection and visualization of data. This can help the viewers identify key insights and get the gist of the entire process. From Net Promoter Scores to complex statistical analyses, each slide is crafted for clarity and impact. Its appealing color scheme, impactful layout, and crystal-clear approach ensure there are no discrepancies left in the presentation. Compatible with Google Slides for seamless collaboration. So don't wait; engage with data like never before and transform insights into informed strategic decisions.
Template 2: Quantitative Survey Data Analysis to Identify Best Channels for Targeting Customers
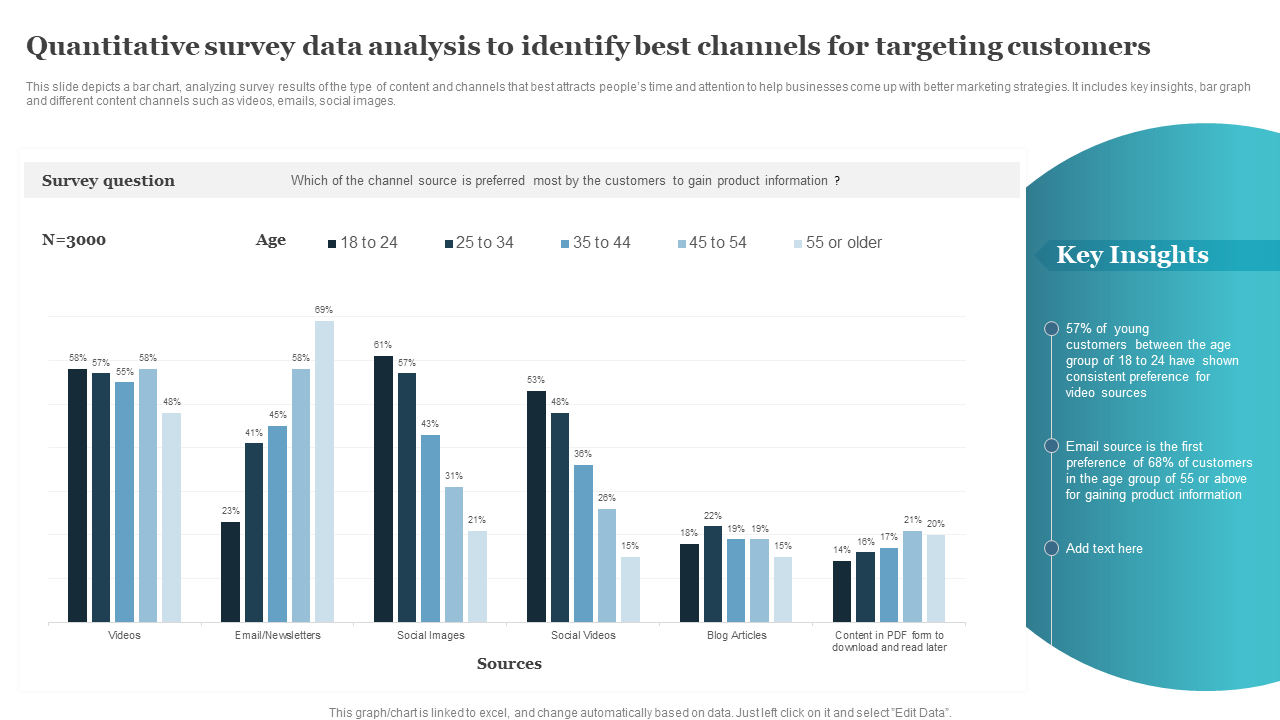
If you are looking for the right channel to target customers, this template can be of great help. This template provides the customer preferences for content channels by age, from videos to social media images to blogs. The bar graphs, color-coded layout, and simple UI make this template very useful for businesses. Collecting such invaluable data can help you optimize your sales channels and focus on getting maximum conversions. The clear visual representation aids in quickly discerning trends and aligning marketing efforts with customer preferences. This example showcases a survey of 3,000 participants. In doing so, it offers key insights, such as the high preference for video content among the 18 to 24 age bracket and a significant inclination towards email for those 55 or older.
Template 3: Survey Data Analysis Tool Comparison Matrix
There are a plethora of tools to select from while conducting survey data analysis. This template simplifies the selection procedure as it offers a clear comparison between these tools. The side-by-side layout ensures you can compare each feature of the tool pretty effectively. The template categorizes the tools based on their description, best-use case, pros, and pricing. This template directly addresses the challenge of choosing the right tool for specific data analysis needs. Result? Businesses and analysts don't have to go through each and every tool before finalizing any one of them. If you, too, are struggling to identify the right tool for your research data analysis, download this template now.
Template 4: Framework for Efficient Analysis of Survey Data
A major issue with survey data analysis is the overwhelming and underutilized data. But this template can fix that problem. It dissects the entire process into a six-step pathway for researchers to turn vast datasets into meaningful insights. It starts with the careful construction of survey questions. Then, it talks about the second step, where the task is to determine the appropriate sample sizes. Then, the template addresses another core issue of data analysis paralysis. It does so by introducing structured methods like cross-tabulation and data benchmarking, which are essential for filtering and comparing results. In short, this template helps users to confidently deal with the complexity of survey data.
Template 5: Comparison between Qualitative and quantitative Survey Data Analysis
Now, if you are facing the dilemma of selecting the right data analysis approach, this tool can fix that. It breaks down the detailed differences between qualitative and Qualitative survey data analysis methods. This helps the users to understand the difference between the two methods clearly. For example, it talks about the effectiveness of each method, how the data collection works in each one of them, and what the data types are in each one of them. For researchers uncertain about the direction of their analysis, this template clarifies the distinction: qualitative analysis focuses on unstructured data to capture sentiments, and Qualitative survey data analysis focuses on numerical data to quantify trends.
Template 6: Use Cases of AI in Survey Analysis
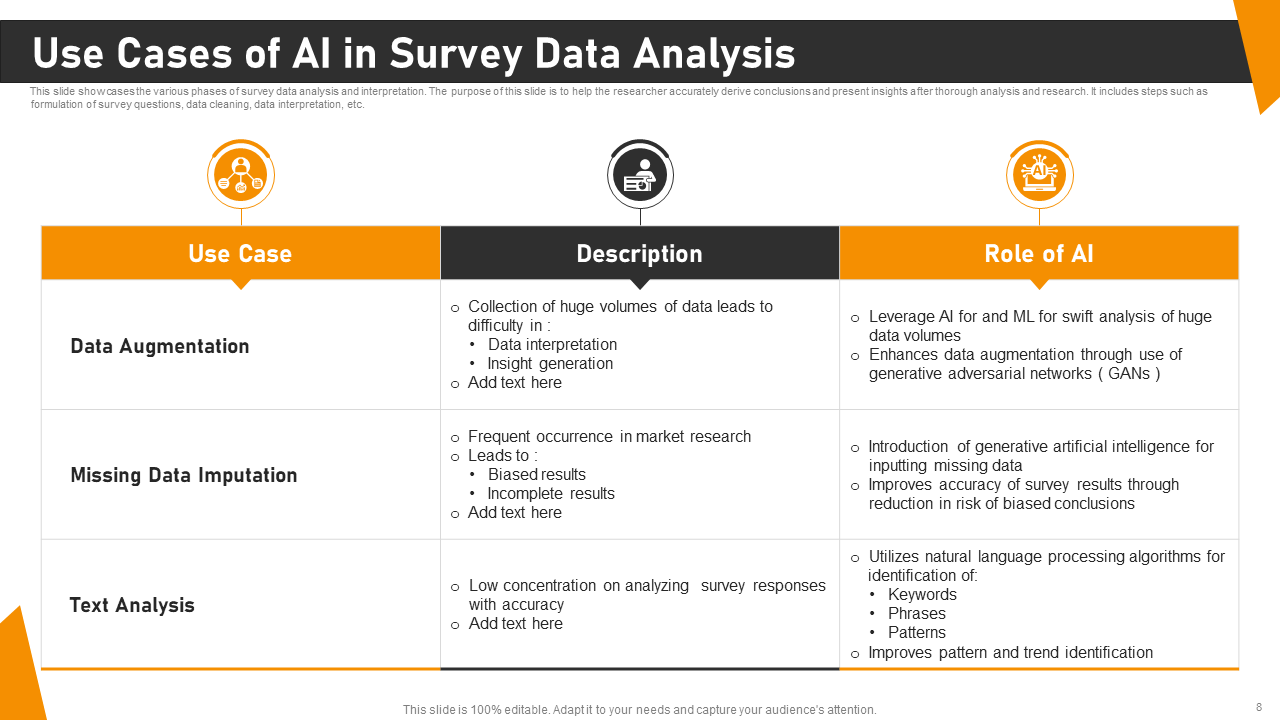
AI is gaining popularity in every field. So why should survey daya analysis get left behind? This template showcases how AI and Machine Learning (ML) can resolve complex data challenges. AI can tackle problems like overwhelming data volumes, missing responses, and in-depth text analysis. All of these problems are common in survey research. But with AI at your disposal, you can enhance your data with augmentation and generative adversarial networks (GANs). This ensures robust and insightful datasets. On the other hand, ML addresses missing data via intelligent imputation and increases the reliability of survey results. In short, this template could be a great starting point for those who are planning to use AI for survey data analysis.
Template 7: Challenges to Online Data Analysis
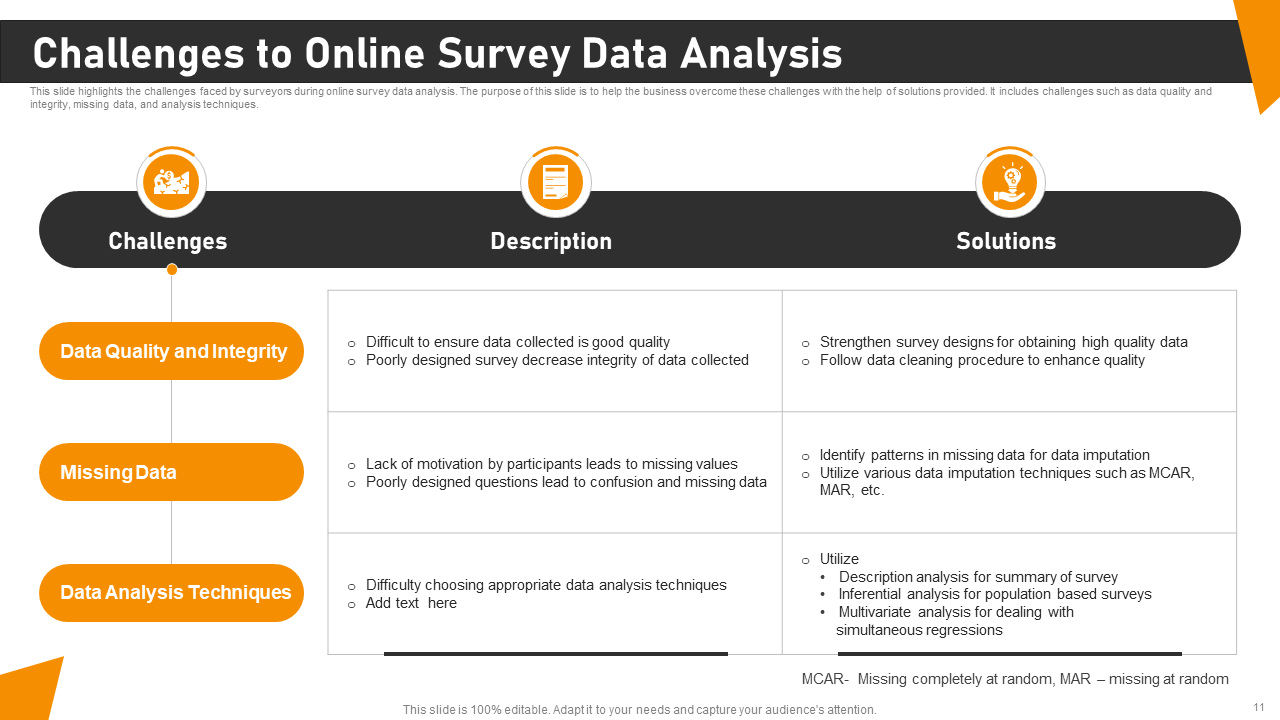
A lot of challenges popped up during the survey data analysis. This template aims to identify those problems early and fix them. It can fix issues with data quality, missing data, and selecting the right analysis techniques. This template is extremely helpful for researchers and businesses who are facing the challenge of ensuring the reliability of their survey data. It offers practical solutions such as enhancing survey design for better data quality, employing data cleaning procedures, and utilizing various imputation methods to handle missing data. The best part? It can help users choose the most appropriate data analysis techniques for their specific survey context. This can help them mitigate the risk of unreliable findings and support the derivation of valid insights.
Template 8: Dashboard Representing Customer Satisfactions Survey Data
This template represents the key customer satisfaction metrics that a business would need to gauge the mood of its customers. It makes the presentation engaging with lots of relevant icons. For example, the template showcases key metrics, such as Net Promoter Score and Customer Effort Score, alongside customer evaluations of product quality survey, price, design, and service. Moreover, this template fuses gauges, bar charts, and feedback icons to provide a clear, at-a-glance view of customer sentiment and service performance over time. This template can help businesses quickly assess and respond to customer Quarterly satisfaction score trends. Result? You get clear customer feedback that you can act upon. With such a data-driven approach, companies can prioritize areas for enhancement, fostering loyalty and driving growth.
Template 9: Dashboard for Analysis of Business Product Survey Data
This template gives a clear and segmented picture of customer demographics and behaviors. The age group pie chart breaks down the product's appeal across generations. Similarly, the bar chart shows the regularity of product use within each demographic. The duration of usage by age group highlights customer retention and product lifecycle. Last but not least, the template shows the buyer sentiment analysis gauge. This template can help identify perceived quality, providing essential insights into public perception. In short, this template enables businesses to pinpoint target demographics, understand product usage patterns, and gauge overall customer satisfaction.
Template 10: Types of Statistical Analysis for Survey Data Interpretations
This template provides a crisp and clear overview of various analytical methods that can be used to collect insights from survey data. For example, it presents regression analysis for identifying relationships between variables. Similarly, it also talks about cluster analysis for understanding data point groupings and T-tests for comparing group means. Finally comes ANOVA, which can assess differences across multiple groups. In short, this regression analysis template acts as a guide T for researchers to choose the right statistical tool, ensuring robust data analysis and interpretation. So, if you too are dealing with survey data analysis issues, download this template now.
Wrapping Up
Data Survey analysis is quickly becoming popular amongst businesses and researchers. However, to get the best output, it's vital to have tools that can deal with large data piles and analyze them effectively. The templates mentioned in this list do exactly that! They break down unfiltered data into small, digestible, and visually appealing information. And with such information, it's easy and quick to act upon. So don't wait; download this template and get started!


 Customer Reviews


