


Data analytic powerpoint presentation slides


Try Before you Buy Download Free Sample Product
 Impress Your
 Audience
Editable
of Time


Discover useful information, inform the conclusion, and support the process of decision making with our Data Analytics ppt. Perform an intelligent market overview of your business focusing on the statistics, trends, market size, key drivers, and market evolution using our inspecting PPT layout. Our business intelligence PowerPoint presentation shows various uses of intelligent data like the development of new products and services, driving process and cost efficiency, finding new customers, analyzing existing customer needs, value, profitability, and the likelihood of a customer to defect, managing risks, driving strategy etc. These integrating PPT slides showcase the business intelligence trends for tools being used in the industry. Focus on the factors like ROI of your marketing strategy, correct data from the ocean of knowledge, determination of revenue for the business, sales strategy, and anticipation of objectives with the smart data PowerPoint slideshow. Besides this, you can also use the KPI metrics PPT presentation to showcase the use of intelligent data, architectural framework, data design, data integration process, business intelligence design, and analytical techniques in your presentation.
People who downloaded this PowerPoint presentation also viewed the following :
Content of this Powerpoint Presentation
Slide 1: This title slide introduces Data Analytic. Add the name of your company here.
Slide 2: This slide contains the Content. It includes - Architectural Framework, Data Design, Advanced Final Output Results, etc.
Slide 3: This is a table of content slide showing the Business Intelligence Market Overview. It includes - BI Market Size, BI Statistics, Key Drivers, etc.
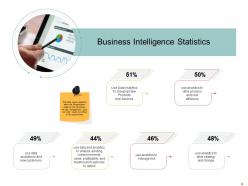
Slide 4: This slide presents the Business Intelligence Statistics. It covers statistics about the BI application usage by the companies for data management.
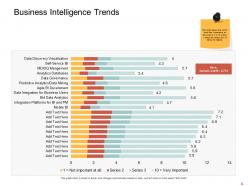
Slide 5: This slide presents the Business Intelligence Trends. It shows which trend has importance on the scale of 1 to 10 was, 1 being the lowest and 10 being the highest.
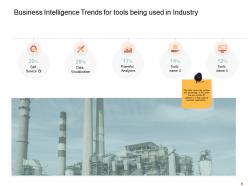
Slide 6: This slide presents the Business Intelligence Trends for tools being used in Industry. It covers the number and percentage of the users that include BI software’s in their suite of business applications.
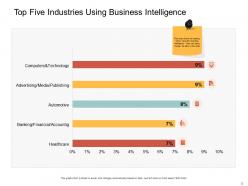
Slide 7: This slide presents the Top Five Industries Using Business Intelligence. It shows the leading sector using business intelligence.
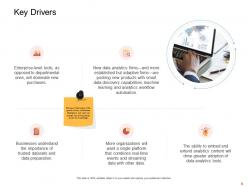
Slide 8: This slide presents the Key Drivers. We have listed some of the growth drivers of Business Intelligence and users can change the driving trends as per their knowledge.
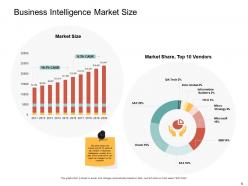
Slide 9: This slide presents the Business Intelligence Market Size. It shows the market size for 10 years & top vendors in the Business Intelligence market.
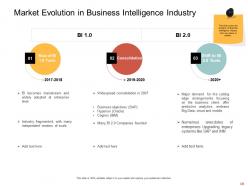
Slide 10: This slide presents the Market Evolution in Business Intelligence Industry. It covers the evolution of the Business Intelligence Industry from one phase to another.
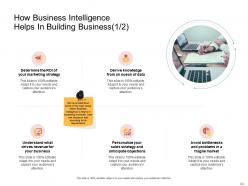
Slide 11: This slide presents How Business Intelligence Helps in Building Business (1/2). We have listed down some of the major areas where Business Intelligence is helpful in increasing revenues.
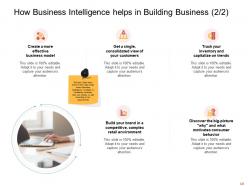
Slide 12: This slide presents How Business Intelligence helps in Building Business (2/2). We have listed down some of the major areas where Business Intelligence is helpful in increasing revenues.
Slide 13: This is a table of content slide showing the Architectural Framework. It includes - Architecture Introduction, Information Architecture, Technology, and Product Architectures, and Data Architecture.
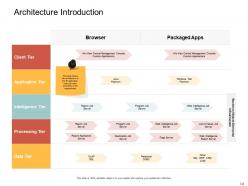
Slide 14: This slide presents the Architecture Introduction. It shows the architecture of the BI application. Users can enter according to their requirements.
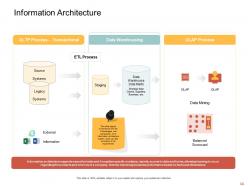
Slide 15: This slide presents the Information Architecture. It depicts a framework with the Technologies and components of an information architecture system.
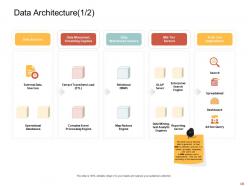
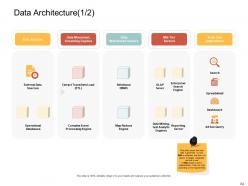
Slide 16: This slide presents the Data Architecture (1/2). It covers that how data is governed i.e., how data is collected, and how it is stored, arranged, integrated, and put to use in data systems and in organizations.
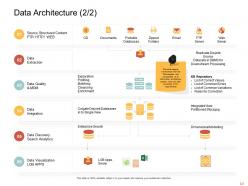
Slide 17: This slide presents the Data Architecture (2/2). It depicts a framework with the Technologies and components of an information architecture system.
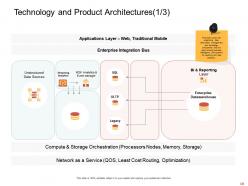
Slide 18: This slide presents the Technology and Product Architectures (1/3). It covers the organizing data, information management, and technology components that are used to build business intelligence (BI) systems for reporting and data analytics.
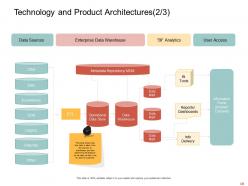
Slide 19: This slide presents the Technology and Product Architectures (2/3). It shows that how data is taken from the sources to the warehouse and then performing BI analytics on the data so that it can be used by customers.
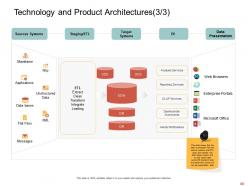
Slide 20: This slide presents the Technology and Product Architectures (3/3). shows that the data is extracted from the source systems with ETL layer and transfer into databases system and on that stored data several BI analytics tools are performed so that we can get presentable data
Slide 21: This is a table of content slide showing the Data Design. It includes - Dimensional Modelling and Foundational Data Modelling.
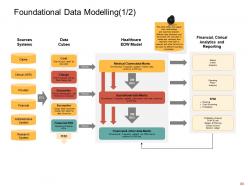
Slide 22: This slide presents the Foundational Data Modelling (1/2). It shows the logical inter-relationships and data flow between different data elements and documents.
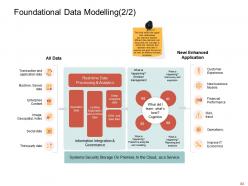
Slide 23: This slide presents the Foundational Data Modelling (2/2).
Slide 24: This slide presents the Data Architecture (1/2). It covers that how data is governed i.e., how data is collected, and how it is stored, arranged, integrated, and put to use in data systems and in organizations.
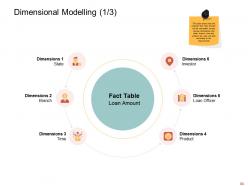
Slide 25: This slide presents the Dimensional Modelling (1/3). It shows that the required fact “loan amount’ can be calculated across various dimensions like state, branch, time and product, etc.
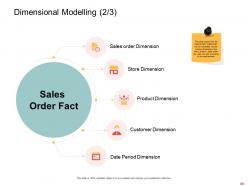
Slide 26: This slide presents the Dimensional Modelling (2/3). It shows that the required fact “sales order’ can be calculated across various dimensions like a store, product, sales order, etc.
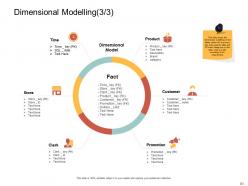
Slide 27: This slide presents the Dimensional Modelling (3/3). It shows the dimensional modeling of the tables where PK is the primary key of the specific table and FK is the foreign key in the fact table.
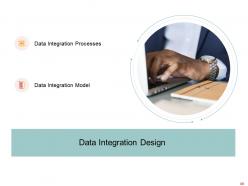
Slide 28: This is a table of content slide showing the Data Integration Design. It includes - Data Integration Model and Data Integration Processes.
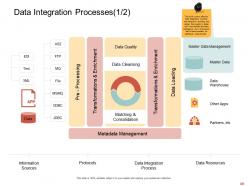
Slide 29: This slide presents the Data Integration Processes (1/2). It covers an effective Data Integration process, with extensive planning and design that results in better and more flexible business intelligence and a framework that is future-proofed for additional requirements.
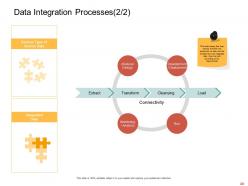
Slide 30: This slide presents the Data Integration Processes (2/2). It shows that how various activities are performed on data and transformed into integrated data.
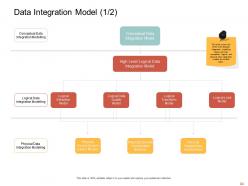
Slide 31: This slide presents the Data Integration Model (1/2). It covers the three main data integration modeling layers and how conceptual, logical, and physical data integration models are broken down.
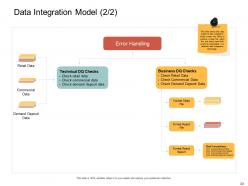
Slide 32: This slide presents the Data Integration Model (2/2). It shows that the data quality & data integration model contains the ability to produce a clean file, reject file, and reject report that would be instantiated in a selected data integration technology.
Slide 33: This is a table of content slide showing the BI Design. It includes - BI Applications, Advanced Analytics, and BI Design & Development.
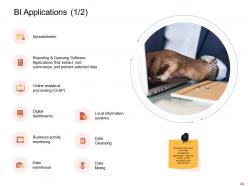
Slide 34: This slide presents the BI Applications (1/2). We have listed some of the data management applications.
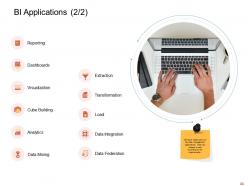
Slide 35: This slide presents the BI Applications (2/2). We have listed some of the data management applications.
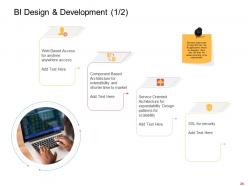
Slide 36: This slide presents the BI Design & Development (1/2). We have listed some of the ways that how the BI applications should be designed.
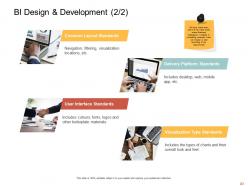
Slide 37: This slide presents the BI Design & Development (2/2). We have listed down some of the major areas where Business Intelligence is helpful in increasing revenues.
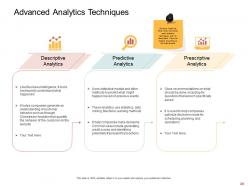
Slide 38: This slide presents the Advanced Analytics Techniques. We have listed the three most commonly used analytics techniques with their description.
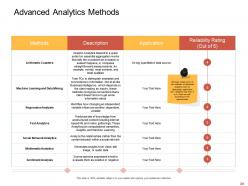
Slide 39: This slide presents the Advanced Analytics Methods. We have listed some of the methods of advanced analytics with their description application and reliability rate from 0 to 5.
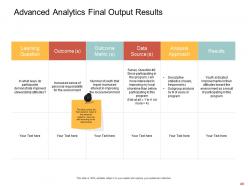
Slide 40: This slide presents the Advanced Analytics Final Output Results. It covers the final outcome result of the advanced analytics.
Slide 41: This is a table of content slide showing the Business Intelligence KPIs & Dashboard. It includes - KPI Dashboards and KPI Metrics.
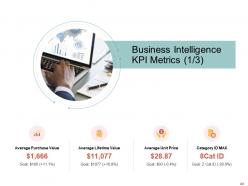
Slide 42: This slide presents the Business intelligence KPI metrics (1/3).
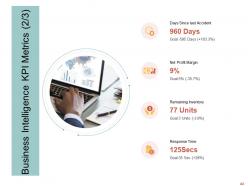
Slide 43: This slide presents the Business intelligence KPI metrics (2/3).
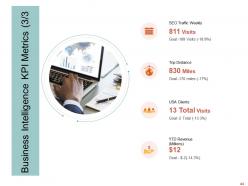
Slide 44: This slide presents the Business intelligence KPI metrics (3/3).
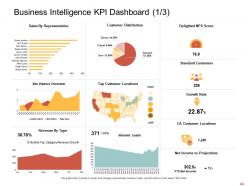
Slide 45: This slide presents the Business Intelligence KPI Dashboard (1/3).
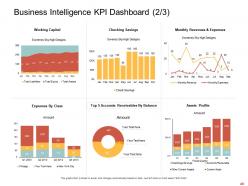
Slide 46: This slide presents the Business Intelligence KPI Dashboard (2/3).
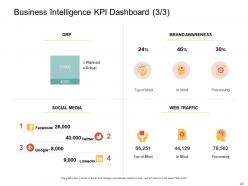
Slide 47: Business Intelligence KPI Dashboard (3/3).
Slide 48: This is the Data Analytic Icons Slide.
Slide 49: This slide introduces the Additional Slides.
Slide 50: This is the Agenda slide.
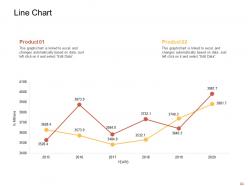
Slide 51: This slide shows a Line Chart that compares 2 products’ data over a timeline of years.
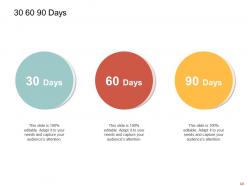
Slide 52: This is a slide with a 30 60 90 Days Plan to set goals for these important intervals.
Slide 53: This slide provides the Mission for the entire company. This includes the vision, the mission, and the goal.
Slide 54: This slide provides a Venn diagram that can be used to show interconnectedness and overlap between various departments, projects, etc.
Slide 55: This is the Circular Diagram slide.
Slide 56: This slide is a Timeline template to showcase the progress of the steps of a project with time.
Slide 57: This is a Thank You slide where details such as the address, contact number, email address are added.
Data analytic powerpoint presentation slides with all 57 slides:
Use our Data Analytic Powerpoint Presentation Slides to effectively help you save your valuable time. They are readymade to fit into any presentation structure.
FAQs for Data analytic
So descriptive analytics is just looking at what already happened - your basic reports and dashboards. Predictive takes that stuff and tries to guess what's coming next, like which customers might bail or how sales will look. Then prescriptive is the fancy one that actually tells you what to do about it. Most companies are still a hot mess with just the basic reporting though, honestly. You gotta get your data foundation right first. Can't really jump to predictions if your historical stuff is garbage. Start simple - nail the "what happened" part, then worry about the crystal ball stuff later.
Honestly, data analytics is a game-changer for catching stuff you'd never notice otherwise. Like, your gut might say one thing, but the numbers tell a completely different story - suddenly you realize that expensive marketing campaign was actually trash, or there's some weird bottleneck slowing everything down. I got way too into it when I first started lol. The trick is picking metrics that actually matter to your goals instead of chasing random stats that look impressive but don't mean anything. Just pick one thing you want to fix and track what's really relevant there. Trust me, once you see real insights, you'll be hooked.
Data viz is basically how you turn messy analytics into something stakeholders can actually understand. Pick the right charts - bar for comparisons, line for trends, that stuff. Keep it clean though. I've literally watched execs ignore amazing insights because the visual looked like garbage. Your audience matters more than anything - test with real people first if you can. Use consistent colors and don't clutter everything up. Focus on the one or two things you want them to walk away remembering. Trust me, ugly charts kill good data every time.
Okay so first things first - get proper consent and make sure people actually understand what you're doing with their data. Privacy stuff is huge right now. Watch out for bias in your algorithms too, because that can really screw over certain groups if you're not paying attention. Security's another big one - what happens if someone hacks your system? Document everything you do and be honest about where your methods fall short. Honestly, the whole thing comes down to this: would you be cool seeing your project on the front page of a newspaper? If that makes you sweat, probably rethink your approach.
So basically you just drop your trained models right into your data pipelines. New data comes in, predictions come out automatically - pretty neat actually. Databricks and AWS make this way less painful than it used to be (seriously, it was terrible before). Set up your models to retrain themselves on a schedule since things shift over time. Just think of ML models like any other step that transforms your data. Oh, and definitely start with one simple use case first. Get that working completely, then expand. Way easier than trying to do everything at once.
Start with Google Analytics and Excel/Google Sheets - both free and honestly pretty solid. Tableau Public's awesome for visuals if you need that. Power BI isn't too pricey either. Here's the thing though - I've watched so many small businesses go overboard right away and just confuse everyone. Better to nail the basics first, you know? Your team's gotta actually want to use whatever you pick. SQL databases or Looker Studio can come later when you're ready. Don't get caught up in the fancy stuff yet.
Honestly, the data you're already collecting can tell you so much about what your customers actually want. Track their behavior patterns and you'll spot problems before they blow up. Real-time feedback beats waiting months for survey results any day. I've seen companies totally transform their customer experience just by segmenting better and personalizing their approach. You can literally predict what people need next - sounds fancy but it's not that complicated. The trick is actually doing something with those insights instead of just collecting them. Fix the friction points, customize your messaging, and watch satisfaction scores jump.
So basically, real-time analytics means you catch issues while they're happening instead of hearing about them in some boring monthly report later. Your team can actually fix bottlenecks or resource problems before everything goes to hell. Think of it like having a constantly updating dashboard for your whole operation - honestly, it's pretty game-changing once you get used to it. Instead of always putting out fires, you'll be ahead of the curve making smart decisions fast. I'd say start small though, pick one process and see how much quicker you can respond to changes.
Oh man, data cleaning is such a pain - you'll spend forever dealing with missing values, wonky formats, and duplicates. I swear it eats up most of your time instead of doing fun analysis stuff. For missing data, figure out early if you want to drop rows, fill them, or interpolate based on what makes sense. Duplicates are tricky because they're not always exact matches. Standardization rules help with formatting chaos, but honestly just pick something and be consistent. Pro tip: make yourself a checklist and save your cleaning scripts. Trust me, you don't want to rebuild this stuff from scratch every single project.
Look, you've gotta set your baseline numbers first - before you do anything else. Pick like 2-3 KPIs that actually matter to your business outcomes. Hard ROI is the stuff your CFO cares about: more revenue, cutting costs, saving time. Soft benefits are harder to pin down but still count - faster decisions, better customer insights, that kind of thing. Honestly, the soft stuff can be just as valuable even if it's annoying to measure. Track everything consistently for at least 6 months, maybe a year. Don't overthink it though - just build your framework around those core metrics you picked.
SQL and Python are your bread and butter - learn those first. Stats knowledge is huge too, like hypothesis testing and regression stuff. Fair warning though, you'll spend like 80% of your time just cleaning gross data (nobody tells you this upfront lol). Tableau or Power BI for visualizations since everyone wants flashy dashboards. Communication skills are surprisingly critical - you're constantly translating tech stuff for people who don't get it. Python opens way more doors than R in my experience. Start there and build out.
Dude, your cultural background totally warps how you read data - what screams "obvious pattern" to you might look completely different to someone else. You'll miss certain trends while zeroing in on others that feel "normal" to your experience. The data's already biased anyway since it reflects whoever collected it. Oh, and people from different cultures handle uncertainty way differently - some want rock-solid proof while others are cool with maybes. I learned this the hard way on a project once. Before you make any big calls based on your analysis, definitely run it by people from other backgrounds first.
AI analytics are getting ridiculously good at spotting stuff we'd never catch. Real-time streaming is where it's at if you need instant decisions. Edge computing's cool too - processes data right where you collect it instead of bouncing everything to the cloud first. The whole "citizen data scientist" trend is blowing up way faster than anyone predicted. Random people without tech backgrounds are suddenly using these self-service tools like pros. Honestly? Just audit what you've got now and pick one spot where real-time insights would actually matter. Don't overthink it.
So basically data analytics tracks your resource usage and helps cut waste - pretty straightforward stuff. You can monitor energy patterns, spot supply chain inefficiencies, measure carbon footprints. Honestly, most companies are shocked at how much waste they find once they actually look at their data (which is kind of embarrassing but whatever). Setting measurable sustainability goals becomes way easier when you've got numbers to work with. You'll see trends that actually help with decisions instead of just guessing. My advice? Pick one area first - energy or waste management work well. Just start collecting some baseline data and go from there.
Only grab data you actually need first - no point hoarding stuff you won't use. Scrub all the personal identifiers (honestly, you'll get weirdly good at writing regex for this). Set up proper access controls so Karen from accounting can't peek at sensitive stuff. Encrypt everything - both stored data and when it's moving around. You'll want audit logs too, tracking who looked at what. But here's the thing - loop in your legal team early on. Way less painful than trying to fix privacy issues after you've already built everything. Trust me on that one.
-
Good research work and creative work done on every template.
-
The content is very helpful from business point of view.
-
Easy to edit slides with easy to understand instructions.
-
Wonderful templates design to use in business meetings.
-
Easy to edit slides with easy to understand instructions.
-
Thanks for all your great templates they have saved me lots of time and accelerate my presentations. Great product, keep them up!
-
Amazing product with appealing content and design.
-
Out of the box and creative design.
-
Innovative and Colorful designs.
-
Amazing product with appealing content and design.
-
Page:
- You're currently reading page 1
- Page 2
-
