


Data scientist powerpoint presentation slides


Try Before you Buy Download Free Sample Product
 Impress Your
 Audience
Editable
of Time


Data science is an area of study that combines domain experience, computer abilities, and mathematical and statistical understanding to extract valuable insights from data. Here is an insightfully designed Data Scientist template that will greatly assist companies in presenting an overview of their current scenario and assessing the need for data science adoption. In addition, it contains information on the requirements of the data science adoption, life cycle and phases of data science, and critical components of the data science. Furthermore, this data scientist template includes the data science tools such as SAS, Apache Spark, Excel, Tableau, NLP, and TensorFlow, along with this role of data science in decision making. Moreover, this module highlights the difference between data science and other tools, data science workflow, job roles in data science, and top data science applications such as healthcare, logistic, finance, airlines, and business. Lastly, this template comprises a checklist, a timeline, a roadmap, a 30-60-90-day plan, a dashboard, and impacts of the data science integration on the organization. Customize this 100 percent editable template now.
People who downloaded this PowerPoint presentation also viewed the following :
Content of this Powerpoint Presentation
Slide 1: This slide introduces Data Scientist. State Your Company Name and begin.
Slide 2: This is an Agenda slide. State your agendas here.
Slide 3: This slide presents Table of Content for the presentation.
Slide 4: This is another slide continuing Table of Content for the presentation.
Slide 5: This slide highlights title for topics that are to be covered next in the template.
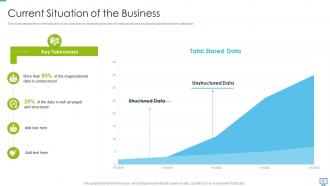
Slide 6: This slide presents current situation of our business by displaying the ratio of unstructured and structured data stored in the database.
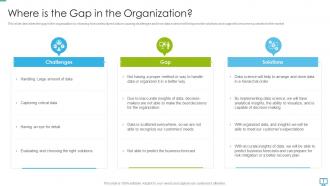
Slide 7: This slide shows how unstructured data is causing challenges and how data science will help provide solutions.
Slide 8: This slide displays Table of Content for the presentation.
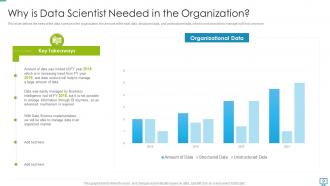
Slide 9: This slide represents the need of the data science in the organization.
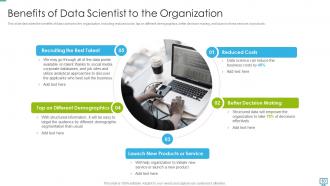
Slide 10: This slide shows Benefits of Data Science to the Organization.
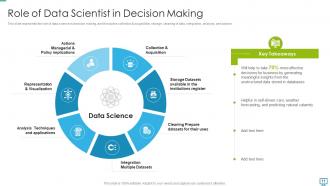
Slide 11: This slide presents the role of data science in decision making, and it includes collection & acquisition, storage, cleaning of data, etc.
Slide 12: This slide shows Table of Content for the presentation.
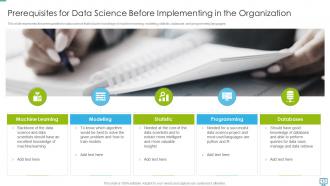
Slide 13: This slide displays the prerequisites for data science that include knowledge of machine learning, modeling, statistic, database, and programming languages.
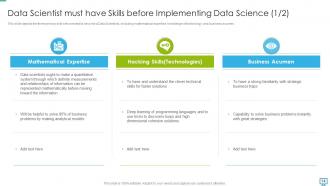
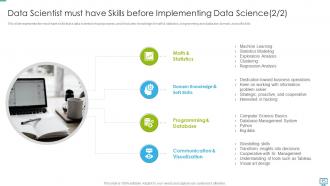
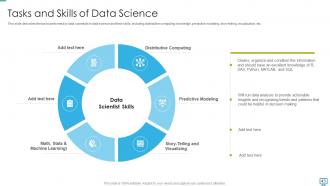
Slide 14: This slide represents Data Scientist Must Have Skills Before Implementing Data Science.
Slide 15: This is another slide showing Data Scientist must have Skills before Implementing Data Science.
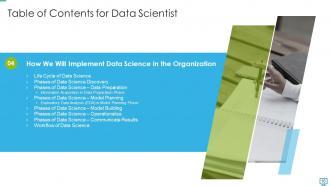
Slide 16: This slide presents Table of Content for the presentation.
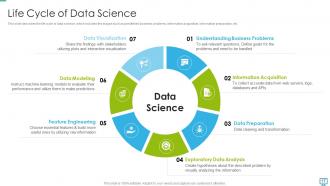
Slide 17: This slide describes the life cycle of data science, which includes the stages such as predefined business problems, information acquisition, etc.
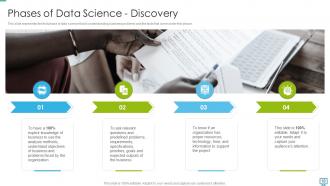
Slide 18: This slide displays the first phase of data science that is understanding business problems and the facts that come under this phase.
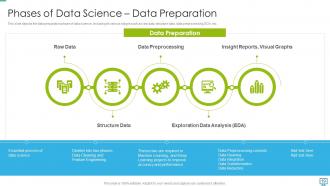
Slide 19: This slide represents the data preparation phase of data science, including its various stages such as raw data, structure data, data preprocessing, EDA, etc.
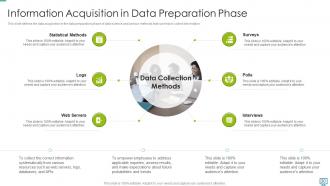
Slide 20: This slide shows Information Acquisition in Data Preparation Phase.
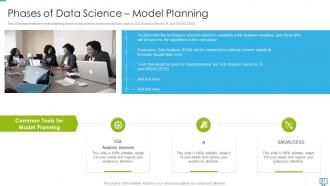
Slide 21: This slide presents model planning phase in data science and shows its tools, such as SQL Analysis Service, R, and SAS/ACCESS.
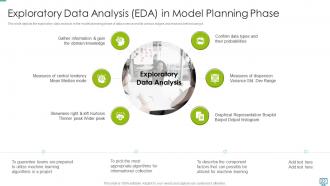
Slide 22: This slide shows exploratory data analysis in the model planning phase of data science and its various stages and reasons.
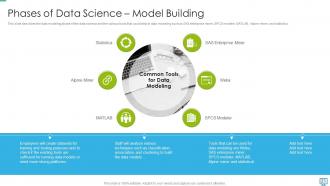
Slide 23: This slide displays various tools that could help in data modeling such as SAS enterprise miner, SPCS modeler, MATLAB, etc.
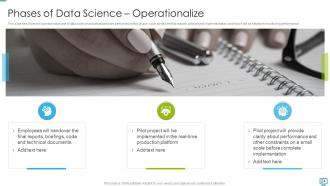
Slide 24: This slide represents operational phase of data science and what tasks are performed in this phase.
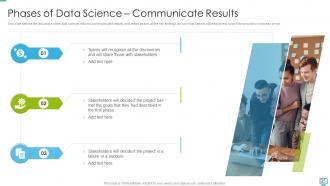
Slide 25: This slide shows last phase of the data science and in this phase, all the key findings are communicated to stakeholders.
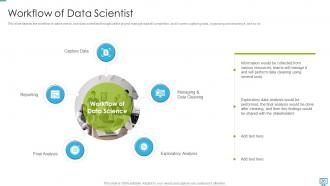
Slide 26: This slide presents how data scientists throughout the project manage data till completion.
Slide 27: This slide shows Table of Content for the presentation.
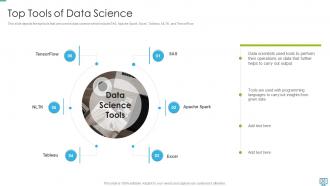
Slide 28: This slide displays top tools that are used in data science which include SAS, Apache Spark, Excel, etc.
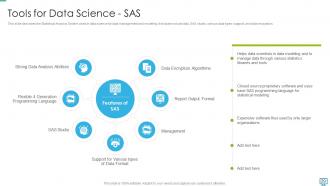
Slide 29: This slide represents Statistical Analysis System used in data science for data management and modeling.
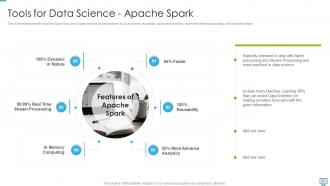
Slide 30: This slide shows Apache Spark tool used in data science and its features such as speed, reusability, advanced analytics, etc.
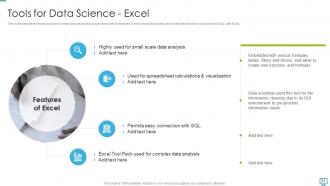
Slide 31: This slide presents excel tool used in data science and its usage along with its features.
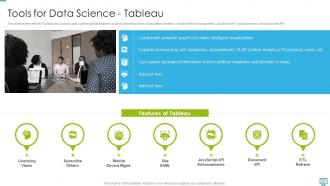
Slide 32: This slide shows tool used in data science and its features such as licensing views, subscription of others, etc.
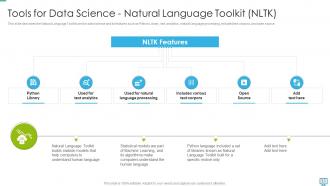
Slide 33: This slide displays Tools for Data Science- Natural Language Toolkit (NLTK).
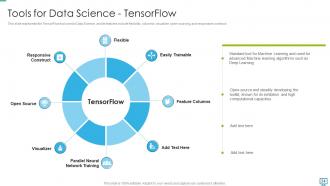
Slide 34: This slide represents TensorFlow tool used in Data Science, and its features include flexibility, columns, visualizer, etc.
Slide 35: This slide shows Table of Content for the presentation.
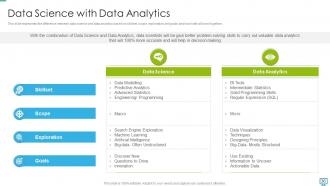
Slide 36: This slide presents difference between data science and data analytics based on skillset, scope, exploration and goals.
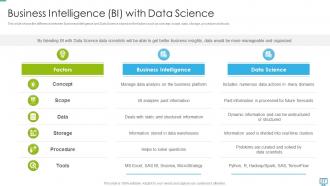
Slide 37: This slide shows difference between Business Intelligence and Data Science based on the factors such as concept, scope, data, etc.
Slide 38: This slide displays Table of Content for the presentation.
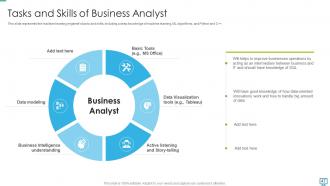
Slide 39: This slide represents tasks performed by the business analyst and how he will be helpful to improve business operations.
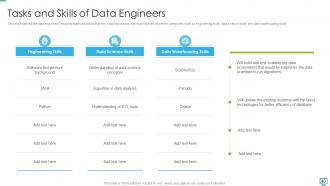
Slide 40: This slide shows data engineers’ responsibilities and skills that they should possess.
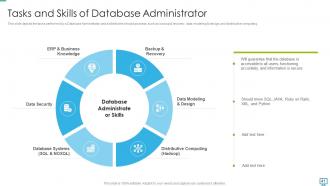
Slide 41: This slide presents tasks performed by a Database Administrator and skills that he should possess.
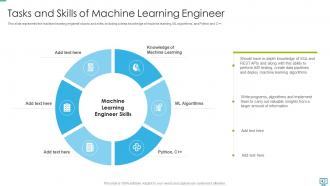
Slide 42: This slide shows machine learning engineer’s tasks and skills, including a deep knowledge of machine learning, ML algorithms, and Python and C++.
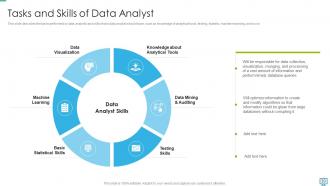
Slide 43: This slide displays the tasks performed by data scientists in data science and their skills.
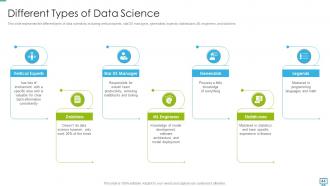
Slide 44: This slide represents the different types of data scientists, including vertical experts, stat DS managers, generalists, etc.
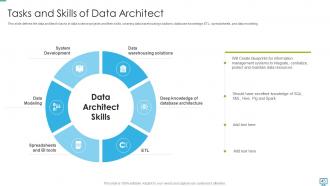
Slide 45: This slide shows data architect’s tasks in data science projects and their skills.
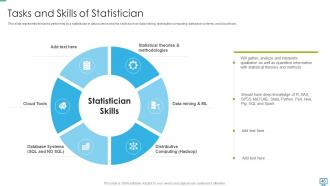
Slide 46: This slide presents tasks performed by a statistician in data science and his skills such as data mining, distributive computing, etc.
Slide 47: This slide shows tasks performed by the business analyst and how he will be helpful to improve business operations.
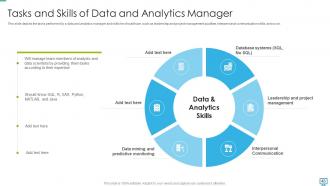
Slide 48: This slide displays tasks performed by a data and analytics manager and skills he should have.
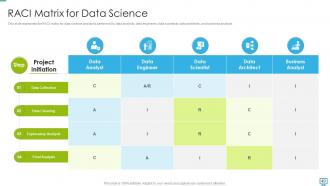
Slide 49: This slide represents RACI matrix for data science and tasks performed by data analysts, data engineers, data scientists, etc.
Slide 50: This slide shows Table of Content highlighting Checklist for Effective Data Science Integration in Business.
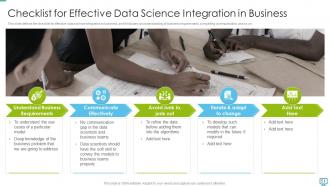
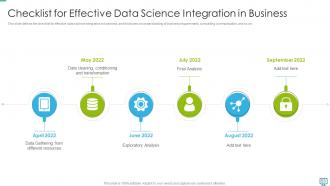
Slide 51: This slide presents Checklist for Effective Data Science Integration in Business.
Slide 52: This slide shows Table of Content highlighting Timeline for Data Science Implementation in the Organization.
Slide 53: This slide displays Table of Content highlighting Timeline for Data Science Implementation in the Organization.
Slide 54: This slide represents Table of Content highlighting Roadmap to Integrate Data Science in the Organization.
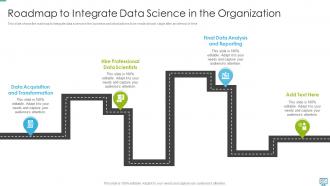
Slide 55: This slide shows Roadmap to Integrate Data Science in the Organization.
Slide 56: This slide presents Table of Content highlighting 30-60-90 Days Plan for Data Science Implementation.
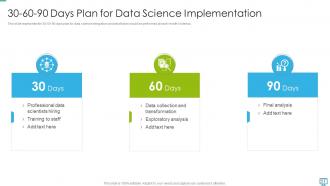
Slide 57: This slide shows 30-60-90 Days Plan for Data Science Implementation.
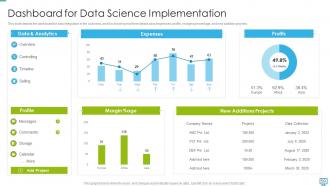
Slide 58: This slide displays Dashboard for Data Science Implementation.
Slide 59: This slide represents dashboard for data integration in the business, and it is showing real-time details about expenses, profits, margins percentage, etc.
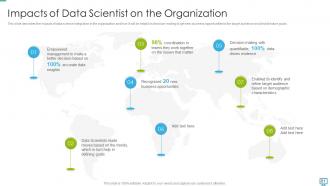
Slide 60: This slide shows Table of Content highlighting Impacts of Data Science Integration in the Organization.
Slide 61: This slide presents Impacts of Data Science Integration in the Organization.
Slide 62: This slide shows Table of Content for the presentation.
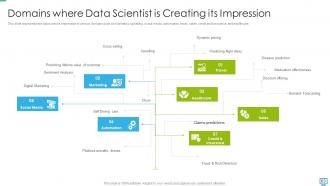
Slide 63: This slide displays Domains where Data Science is Creating its Impression.
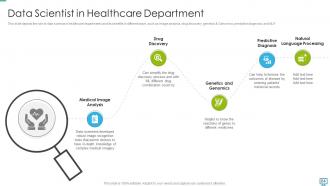
Slide 64: This slide represents data science in healthcare departments and its benefits in different ways.
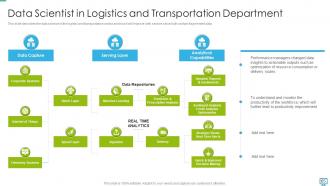
Slide 65: This slide shows Data Science in Logistics and Transportation Department.
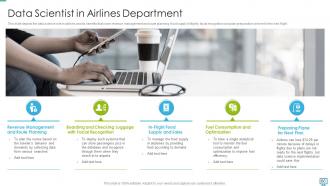
Slide 66: This slide presents data science role in airlines and its benefits that cover revenue management and route planning.
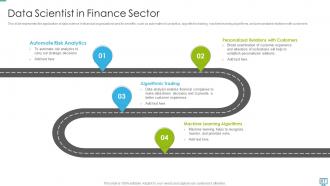
Slide 67: This slide shows application of data science in financial organizations and its benefits.
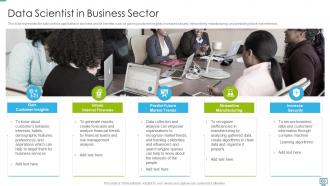
Slide 68: This slide displays the data science application in business and its benefits.
Slide 69: This slide displays Icons for Data Scientist.
Slide 70: This slide highlights title for topics that are to be covered next in the template.
Slide 71: This slide is titled as Additional Slides for moving forward.
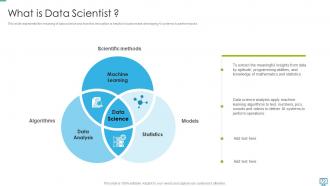
Slide 72: This slide represents the meaning of data science and how this innovation is helpful in businesses developing AI systems.
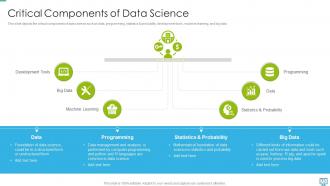
Slide 73: This slide depicts the critical components of data science such as data, programming, statistics, etc.
Slide 74: This slide contains Puzzle with related icons and text.
Slide 75: This slide provides 30 60 90 Days Plan with text boxes.
Slide 76: This is an Idea Generation slide to state a new idea or highlight information, specifications etc.
Slide 77: This is a Timeline slide. Show data related to time intervals here.
Slide 78: This slide shows Post It Notes. Post your important notes here.
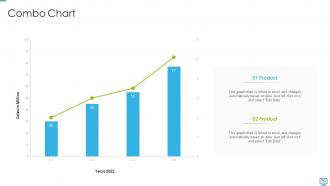
Slide 79: This slide describes Combo chart with two products comparison.
Slide 80: This is Our Goal slide. State your firm's goals here.
Slide 81: This slide presents Roadmap with additional textboxes.
Slide 82: This is a Thank You slide with address, contact numbers and email address.
Data scientist powerpoint presentation slides with all 87 slides:
Use our Data Scientist Powerpoint Presentation Slides to effectively help you save your valuable time. They are readymade to fit into any presentation structure.


FAQs for Data scientist
Get solid with Python or R first, plus SQL and basic stats. Machine learning comes next - learn when different algorithms actually make sense, not just how to run them. But here's the thing nobody talks about enough: communication skills will make or break you. You'll spend half your time explaining why your fancy model matters to people who just want simple answers. Critical thinking is huge too. Domain knowledge in whatever industry you're targeting? That's where you'll actually stand out. Start with whichever area feels shakiest - probably the technical stuff if you're like most people.
First figure out what you're actually trying to do - predict stuff, spot patterns, or sort data into buckets. Your dataset matters too. Big or small? Clean or a total disaster? (Usually it's a disaster lol). Sometimes your boss will want to know WHY the model made a decision, not just if it's right. I always start simple though - linear regression, decision trees, that kind of thing. Don't jump straight to neural networks just because they're fancy. Test basic stuff first, then get more complex if you need better results.
Oh man, data cleaning is such a pain but you'll literally spend like 70% of your time on it. Way more than the actual fun modeling part, which sucks but whatever. You gotta deal with missing values, duplicates, weird inconsistencies - all that boring stuff before you can do anything useful. Your models are only gonna be as good as your data, so if you skip this step you're basically screwed. I learned this the hard way lol. Seriously though, budget way more time than you think you'll need. Oh and profile your dataset first so you know what mess you're dealing with.
Honestly, good visualizations are like telling a story instead of just throwing spreadsheets at people. You're basically walking them through what matters rather than making them decode everything themselves. The magic happens when someone looks at your chart and goes "oh shit, NOW I see it." That's way better than endless tables nobody wants to read. Charts can actually build suspense - weird but true. I always sketch out what story I'm trying to tell first, then figure out which visuals will actually support that. Don't just pick whatever looks pretty in Excel.
First thing - make sure people actually said yes to how you're using their stuff. Anonymize properly too, not just scrubbing names but really making it untraceable. Store everything securely and don't hoard data longer than you need it. Be upfront about any bias in your algorithms that might screw over certain groups. Honestly, most people skip the consent part and it bites them later. Short version: would you be cool with someone doing this to your personal info? If not, don't do it.
Honestly, I just make it part of my routine now. Twitter's surprisingly great for this - researchers drop new stuff there all the time. I follow Towards Data Science and get newsletters from KDnuggets too. Reddit's data science communities are solid for real talk from people actually doing the work. Kaggle competitions show you what's trending technique-wise, which is pretty useful. Virtual conferences are hit or miss but worth checking out. Online courses help when there's a totally new tool everyone's buzzing about. The trick is staying consistent instead of panicking when you realize you're three trends behind.
Look, Python and R are the big players for a reason. Python's great for machine learning and data stuff - pandas, scikit-learn, matplotlib are solid libraries. R crushes statistical analysis and has incredible specialized packages. Don't sleep on SQL either, you'll be querying databases nonstop. The Python vs R flame wars are honestly pretty entertaining to watch online. Most companies just pick one though. If you're starting fresh, go Python - way more versatile and the job market's insane right now. Get good at one first, then you can always pick up others later depending on what you need.
So ML is all about training algorithms to spot patterns and make predictions from tons of data. You're not coding specific rules - the system learns them. Traditional stats? That's more for testing theories and figuring out *why* relationships exist between variables. Like, if you want to prove something causes something else, go with stats. Need to predict what'll happen next? ML's your friend. Honestly though, the boundaries get messy and most real projects end up mixing both approaches anyway. I'd say start by asking yourself: do you want to explain something or predict it?
Honestly? Data cleaning will eat up way more time than you think - missing values, weird formats, just messy stuff everywhere. Stakeholders love changing their minds halfway through too, which is super fun. Model selection gets tricky, especially when departments won't share their data with each other. But here's the thing that really kills projects: nobody can translate tech speak into business language. I swear, communication problems wreck more data science work than crappy algorithms ever will. My two cents? Get really clear on what people actually want upfront. Makes everything smoother later.
Dude, you absolutely need those other teams on your side. Marketing has to get what your models actually mean for customers, otherwise they'll just ignore your work. And don't even get me started on IT - they're the ones who'll make or break your stuff in production. I've watched so many genius analyses just die on people's laptops because nobody talked to each other! Marketing can tell you if your insights are total nonsense from a business perspective. IT will catch the stuff that'll blow up their servers. Honestly? Set up regular meetings with both teams right when you start any project.
Dude, big data completely flipped data science on its head. We went from nice, tidy datasets to wrestling with absolute chaos - like terabytes of messy info flowing constantly. You'll need Spark and Hadoop now just to handle the sheer volume. Machine learning that used to take hours? Now it's gotta crunch massive amounts in real-time. Honestly, the scale shift is insane. But here's the cool part - you can spot patterns that were totally invisible with smaller samples. Oh, and definitely get comfortable with cloud platforms soon. Your laptop isn't gonna cut it anymore, trust me.
Honestly, Python and R are where it's at for coding - Python's my favorite since you can use it for way more than just data stuff. Jupyter notebooks are like my second home at this point lol. You'll need SQL for databases obviously, and cloud stuff like AWS or Google Cloud is pretty much required now. Tableau and Power BI cover most viz work. For libraries, pandas and scikit-learn are clutch, plus TensorFlow if you get into ML. Don't sleep on GitHub either. Start with Python and SQL, then maybe pick one cloud platform to dive into.
Domain knowledge makes a huge difference in data science work. You'll ask better questions and catch patterns that actually matter. I've watched people build perfect models that solve totally wrong problems - kinda painful to see honestly. Without understanding the business, you might waste weeks on features that any domain expert would immediately flag as useless. Plus you can explain your results in ways stakeholders will care about. The best thing? Just hang out with people who know the field inside and out. They'll teach you more than any textbook.
Look, track whether your model actually fixes the business problem first. Revenue up? Costs down? That's what matters. Technical stuff like accuracy is obviously important too, but I've watched "amazing" models sit unused because they didn't fit how people work. User adoption is everything - if stakeholders won't use it, you've basically wasted everyone's time. Make sure it's explainable enough that people trust the outputs. Oh, and integration can't be a nightmare. Honestly though, figure out these success metrics with your team before you start building anything. Saves so much headache later.
So basically you gotta split your data - training, validation, test sets. Don't test on stuff the model's already seen, that's cheating lol. Cross-validation catches overfitting before it becomes a nightmare. Accuracy isn't everything though, check other metrics too depending on your data. Edge cases will break things in weird ways, trust me on this one. Oh and data drift is annoying but real - your model won't perform the same forever. Set up monitoring early so you're not scrambling when things go sideways. Automate what you can.
-
Excellent template with unique design.
-
Excellent work done on template design and graphics.