Powerpoint Templates and Google slides for Statistical Analysis
Save Your Time and attract your audience with our fully editable PPT Templates and Slides.
-
 Statistical Analysis For Data Driven Decision Making Powerpoint Presentation Slides
Deliver an informational PPT on various topics by using this Statistical Analysis For Data Driven Decision Making Powerpoint Presentation Slides. This deck focuses and implements best industry practices, thus providing a birds-eye view of the topic. Encompassed with seventy one slides, designed using high-quality visuals and graphics, this deck is a complete package to use and download. All the slides offered in this deck are subjective to innumerable alterations, thus making you a pro at delivering and educating. You can modify the color of the graphics, background, or anything else as per your needs and requirements. It suits every business vertical because of its adaptable layout.
-
 Statistical Analysis Of Research Findings Proposal Example Document Report Doc Pdf Ppt
This is a complete deck titled Statistical Analysis Of Research Findings Proposal Example Document Report Doc Pdf Ppt. It is crafted using high-quality visuals that can be readjusted in PowerPoint and Google Slides. This template comes in an editable format and is available in A4 size format for immediate download.
-
 Statistical Analysis Powerpoint Presentation Slides
Hastily volatile shades, context, fonts, forms, PPT images, Dynamic PPT design in vector formats which can be exportable in to divergent forms like PDF or JPG, , Refurbish able Presentation graphics which is quite compatible with Google slides and other software’s applications, simply add title or subtitles also, quite beneficial for business analysts and specialists etc.
-
 Statistical Analysis Powerpoint Ppt Template Bundles
Deliver a lucid presentation by utilizing this Statistical Analysis Powerpoint Ppt Template Bundles. Use it to present an overview of the topic with the right visuals, themes, shapes, and graphics. This is an expertly designed complete deck that reinforces positive thoughts and actions. Use it to provide visual cues to your audience and help them make informed decisions. A wide variety of discussion topics can be covered with this creative bundle such as Analysis Planning, Statistical Tools, Data Analysis, Financial Status. All the twelve slides are available for immediate download and use. They can be edited and modified to add a personal touch to the presentation. This helps in creating a unique presentation every time. Not only that, with a host of editable features, this presentation can be used by any industry or business vertical depending on their needs and requirements. The compatibility with Google Slides is another feature to look out for in the PPT slideshow.
-
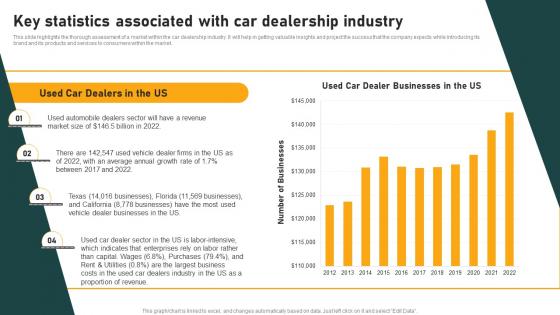 Key Statistics Associated With Car Dealership Industry Introduction And Analysis
This slide highlights the thorough assessment of a market within the car dealership industry. It will help in getting valuable insights and project the success that the company expects while introducing its brand and its products and services to consumers within the market.Present the topic in a bit more detail with this Key Statistics Associated With Car Dealership Industry Introduction And Analysis. Use it as a tool for discussion and navigation on Automobile Dealers, Dealer Businesses, Proportion Revenue. This template is free to edit as deemed fit for your organization. Therefore download it now.
-
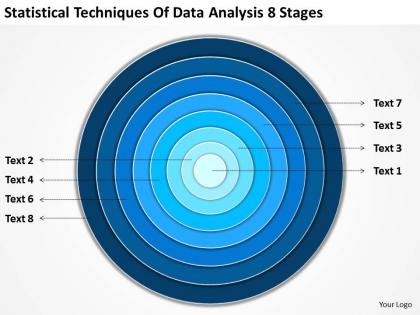 Business logic diagram statistical techniques of data analysis 8 stages powerpoint slides
We are proud to present our business logic diagram statistical techniques of data analysis 8 stages powerpoint slides. This PowerPoint Diagram shows dependencies among parts of an organization or process. This diagram is made of eight stages of concentric circles. Present your views using our innovative slides and be assured of leaving a lasting impression.
-
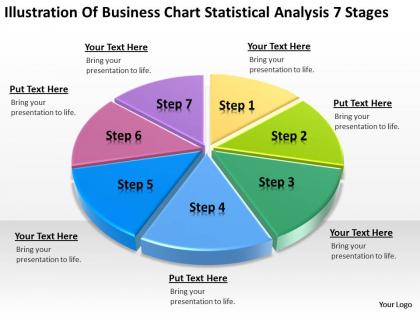 Business flow charts examples of statistical analysis 7 stages powerpoint templates
We are proud to present our business flow charts examples of statistical analysis 7 stages powerpoint templates. Visually support your Microsoft office PPT Presentation with our above template. This diagram graphically displays 3d segmented circular process or pie chart. It can be used for presentations related to stages of business processes, percentage of success of process, business plan from start to the achievement. Create captivating presentations to deliver comparative and weighted arguments.
-
 Scatter Representing Diagram Arrow Statistical Analysis Prediction
Introduce your topic and host expert discussion sessions with this Scatter Representing Diagram Arrow Statistical Analysis Prediction. This template is designed using high-quality visuals, images, graphics, etc, that can be used to showcase your expertise. Different topics can be tackled using the twelve slides included in this template. You can present each topic on a different slide to help your audience interpret the information more effectively. Apart from this, this PPT slideshow is available in two screen sizes, standard and widescreen making its delivery more impactful. This will not only help in presenting a birds-eye view of the topic but also keep your audience engaged. Since this PPT slideshow utilizes well-researched content, it induces strategic thinking and helps you convey your message in the best possible manner. The biggest feature of this design is that it comes with a host of editable features like color, font, background, etc. So, grab it now to deliver a unique presentation every time.
-
 Startup Innovative Business Generation Statistical Product Manufacturing Analysis
Deliver a lucid presentation by utilizing this Startup Innovative Business Generation Statistical Product Manufacturing Analysis. Use it to present an overview of the topic with the right visuals, themes, shapes, and graphics. This is an expertly designed complete deck that reinforces positive thoughts and actions. Use it to provide visual cues to your audience and help them make informed decisions. A wide variety of discussion topics can be covered with this creative bundle such as Startup, Innovative, Business, Generation, Statistical. All the twelve slides are available for immediate download and use. They can be edited and modified to add a personal touch to the presentation. This helps in creating a unique presentation every time. Not only that, with a host of editable features, this presentation can be used by any industry or business vertical depending on their needs and requirements. The compatibility with Google Slides is another feature to look out for in the PPT slideshow.
-
 Four stage funnel revenue success analysis segment statistics plan
Deliver a lucid presentation by utilizing this Four Stage Funnel Revenue Success Analysis Segment Statistics Plan. Use it to present an overview of the topic with the right visuals, themes, shapes, and graphics. This is an expertly designed complete deck that reinforces positive thoughts and actions. Use it to provide visual cues to your audience and help them make informed decisions. A wide variety of discussion topics can be covered with this creative bundle such as Four Stage Funnel, Revenue, Success, Analysis, Segment. All the twelve slides are available for immediate download and use. They can be edited and modified to add a personal touch to the presentation. This helps in creating a unique presentation every time. Not only that, with a host of editable features, this presentation can be used by any industry or business vertical depending on their needs and requirements. The compatibility with Google Slides is another feature to look out for in the PPT slideshow.
-
 Agile supply chain average distribution statistical analysis processing sales
If you require a professional template with great design, then this Agile Supply Chain Average Distribution Statistical Analysis Processing Sales is an ideal fit for you. Deploy it to enthrall your audience and increase your presentation threshold with the right graphics, images, and structure. Portray your ideas and vision using twelve slides included in this complete deck. This template is suitable for expert discussion meetings presenting your views on the topic. With a variety of slides having the same thematic representation, this template can be regarded as a complete package. It employs some of the best design practices, so everything is well-structured. Not only this, it responds to all your needs and requirements by quickly adapting itself to the changes you make. This PPT slideshow is available for immediate download in PNG, JPG, and PDF formats, further enhancing its usability. Grab it by clicking the download button.
-
 Statistics Highlighting Bank Branch Wait Time Analysis
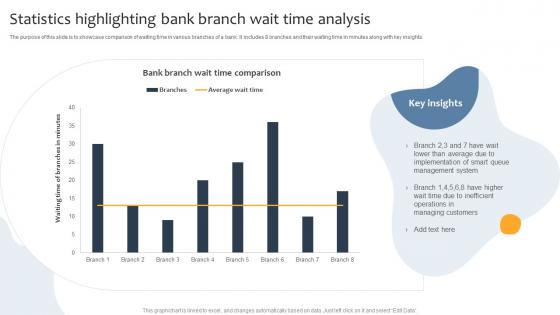
The purpose of this slide is to showcase comparison of waiting time in various branches of a bank. It includes 8 branches and their waiting time in minutes along with key insights. Presenting our well structured Statistics Highlighting Bank Branch Wait Time Analysis. The topics discussed in this slide are Bank Branch, Wait Time Analysis. This is an instantly available PowerPoint presentation that can be edited conveniently. Download it right away and captivate your audience.
-
 Statistical Analysis Of Self Service Channels
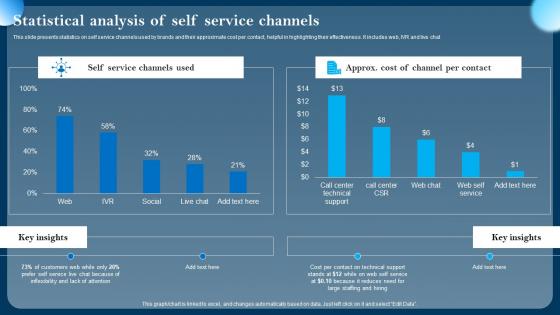
This slide presents statistics on self service channels used by brands and their approximate cost per contact, helpful in highlighting their effectiveness. It includes web, IVR and live chat. Introducing our Statistical Analysis Of Self Service Channels set of slides. The topics discussed in these slides are Statistical, Analysis, Service. This is an immediately available PowerPoint presentation that can be conveniently customized. Download it and convince your audience.
-
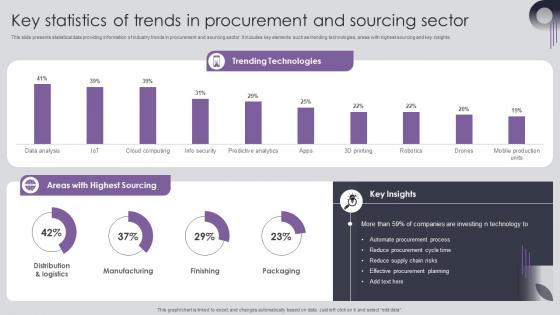 Procurement Risk Analysis And Mitigation Key Statistics Of Trends In Procurement And Sourcing
This slide presents statistical data providing information of industry trends in procurement and sourcing sector. It includes key elements such as trending technologies, areas with highest sourcing and key insights. Present the topic in a bit more detail with this Procurement Risk Analysis And Mitigation Key Statistics Of Trends In Procurement And Sourcing Use it as a tool for discussion and navigation on Manufacturing, Finishing, Packaging This template is free to edit as deemed fit for your organization. Therefore download it now.
-
 Overview Of Waterfall Approach Statistical Analysis Of Software Development Models Usage
This slide showcases the comparison of various approaches of project management to implement in software development. It includes devOp, agile, scrum, Kanban, waterfall, hybrid, lead model. Deliver an outstanding presentation on the topic using this Overview Of Waterfall Approach Statistical Analysis Of Software Development Models Usage Dispense information and present a thorough explanation of Kanban Model, Development Models using the slides given. This template can be altered and personalized to fit your needs. It is also available for immediate download. So grab it now.
-
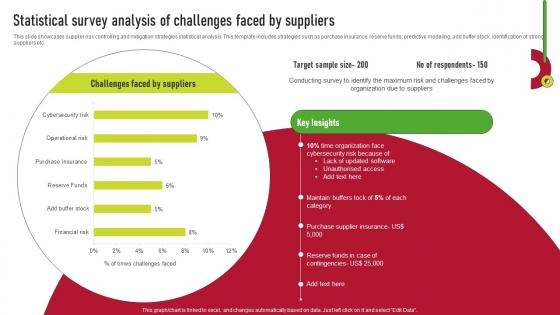 Statistical Survey Analysis Of Challenges Faced By Suppliers Supplier Risk Management
This slide showcases supplier risk controlling and mitigation strategies statistical analysis. This template includes strategies such as purchase insurance, reserve funds, predictive modeling, add buffer stock, identification of strong suppliers etc. Present the topic in a bit more detail with this Statistical Survey Analysis Of Challenges Faced By Suppliers Supplier Risk Management. Use it as a tool for discussion and navigation on Challenges Faced By Suppliers, Statistical Survey Analysis, Faced By Suppliers. This template is free to edit as deemed fit for your organization. Therefore download it now.
-
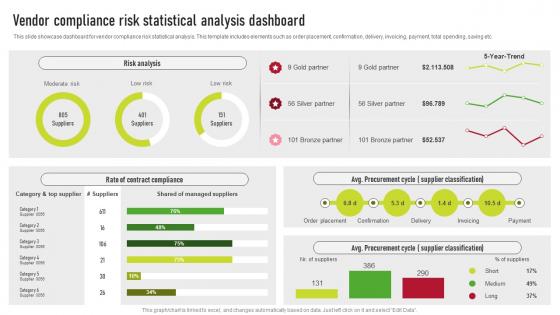 Vendor Compliance Risk Statistical Analysis Dashboard Supplier Risk Management
This slide showcase dashboard for vendor compliance risk statistical analysis. This template includes elements such as order placement, confirmation, delivery, invoicing, payment, total spending, saving etc. Present the topic in a bit more detail with this Vendor Compliance Risk Statistical Analysis Dashboard Supplier Risk Management. Use it as a tool for discussion and navigation on Risk Analysis, Rate Of Contract Compliance, Vendor Compliance. This template is free to edit as deemed fit for your organization. Therefore download it now.
-
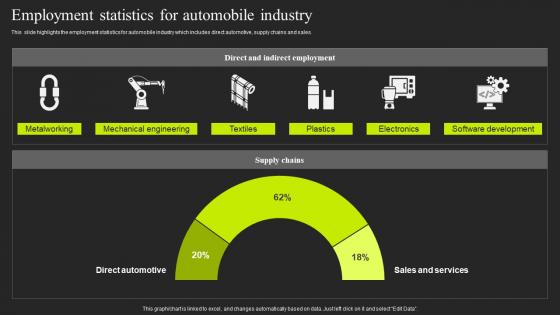 Employment Statistics For Automobile Industry Auto Repair Industry Market Analysis
This slide highlights the employment statistics for automobile industry which includes direct automotive, supply chains and sales. Present the topic in a bit more detail with this Employment Statistics For Automobile Industry Auto Repair Industry Market Analysis. Use it as a tool for discussion and navigation on Metalworking, Mechanical Engineering. This template is free to edit as deemed fit for your organization. Therefore download it now.
-
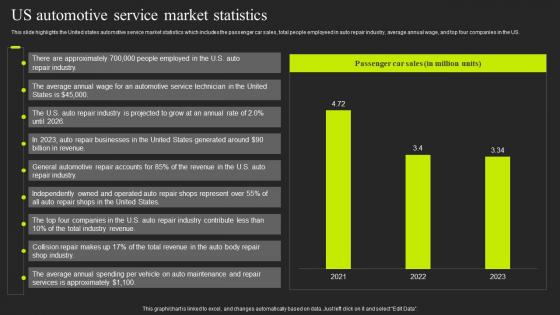 Us Automotive Service Market Statistics Auto Repair Industry Market Analysis
This slide highlights the United states automotive service market statistics which includes the passenger car sales, total people employeed in auto repair industry, average annual wage, and top four companies in the US. Present the topic in a bit more detail with this Us Automotive Service Market Statistics Auto Repair Industry Market Analysis. Use it as a tool for discussion and navigation on Passenger Car Sales. This template is free to edit as deemed fit for your organization. Therefore download it now.
-
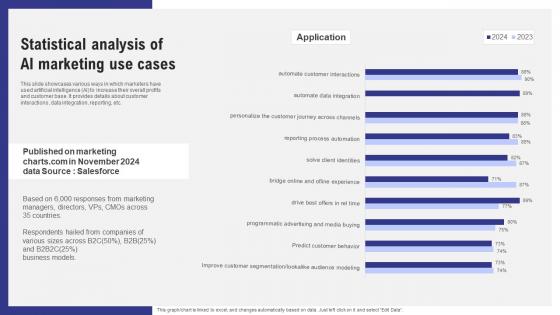 Statistical Analysis Of Ai Marketing Use Cases Ai Marketing Accross Industries AI SS
This slide showcases various ways in which marketers have used artificial intelligence AI to increase their overall profits and customer base. It provides details about customer interactions, data integration, reporting, etc. Deliver an outstanding presentation on the topic using this Statistical Analysis Of Ai Marketing Use Cases Ai Marketing Accross Industries AI SS. Dispense information and present a thorough explanation of Marketing, Statistical, Analysis using the slides given. This template can be altered and personalized to fit your needs. It is also available for immediate download. So grab it now.
-
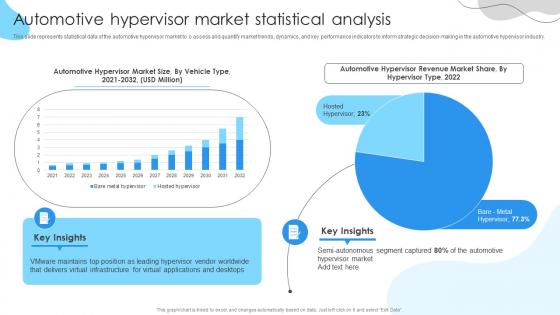 Automotive hypervisor market statistical analysis
slide represents statistical data of the automotive hypervisor market to o assess and quantify market trends, dynamics, and key performance indicators to inform strategic decision making in the automotive hypervisor industry. Introducing our Automotive hypervisor market statistical analysis set of slides. The topics discussed in these slides are Semi Autonomous Segment, Hypervisor Market, Automotive Hypervisor. This is an immediately available PowerPoint presentation that can be conveniently customized. Download it and convince your audience.
-
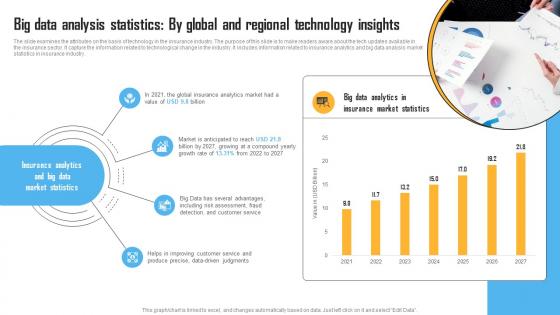 Big Data Analysis Statistics By Global Insurance Industry Report IR SS
The slide examines the attributes on the basis of technology in the insurance industry. The purpose of this slide is to make readers aware about the tech updates available in the insurance sector. It capture the information related to technological change in the industry. It includes information related to insurance analytics and big data analysis market statistics in insurance industry. Present the topic in a bit more detail with this Big Data Analysis Statistics By Global Insurance Industry Report IR SS. Use it as a tool for discussion and navigation on Big Data Analytics, Insurance Market Statistics, Global Insurance Analytics. This template is free to edit as deemed fit for your organization. Therefore download it now.
-
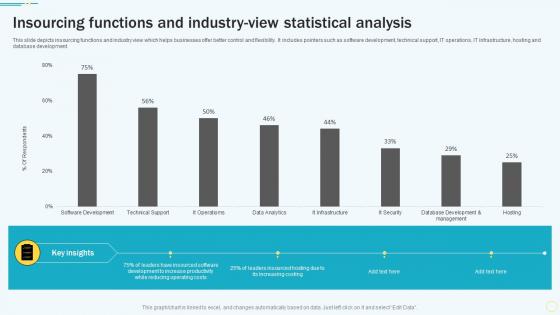 Insourcing Functions And Industry View Statistical Analysis
This slide depicts insourcing functions and industry view which helps businesses offer better control and flexibility. It includes pointers such as software development, technical support, IT operations, IT infrastructure, hosting and database development. Introducing our Insourcing Functions And Industry View Statistical Analysis set of slides. The topics discussed in these slides are Insourced Software, Increase Productivity, Reducing Operating Costs. This is an immediately available PowerPoint presentation that can be conveniently customized. Download it and convince your audience.
-
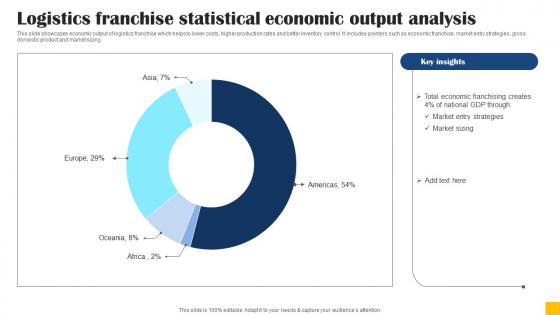 Logistics Franchise Statistical Economic Output Analysis
This slide showcases economic output of logistics franchise which helps to lower costs, higher production rates and better inventory control. It includes pointers such as economic franchise, market entry strategies, gross domestic product and market sizing. Presenting our well structured Logistics Franchise Statistical Economic Output Analysis. The topics discussed in this slide are Competitive Landscape, Customer Segmentation, Market Trends. This is an instantly available PowerPoint presentation that can be edited conveniently. Download it right away and captivate your audience.
-
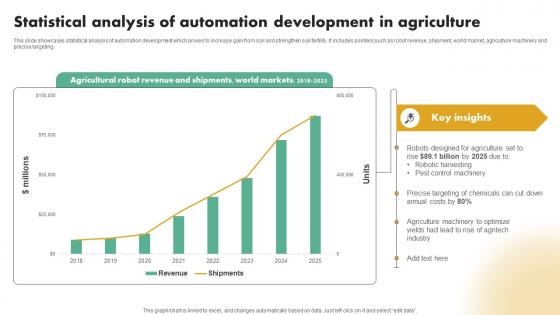 Statistical Analysis Of Automation Development In Agriculture
This slide showcases statistical analysis of automation development which proves to increase gain from soil and strengthen soil fertility. It includes pointers such as robot revenue, shipment, world market, agriculture machinery and precise targeting. Introducing our premium set of slides with Statistical Analysis Of Automation Development In Agriculture. Ellicudate the five stages and present information using this PPT slide. This is a completely adaptable PowerPoint template design that can be used to interpret topics like Agricultural Robot Revenue, Shipments. So download instantly and tailor it with your information.
-
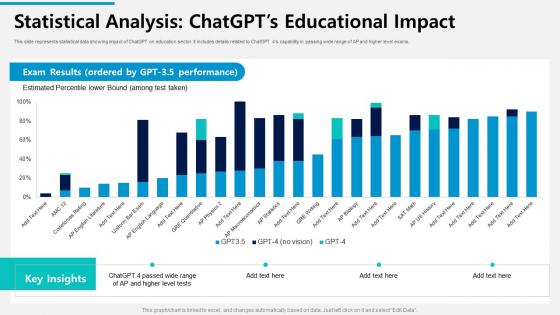 Statistical Analysis ChatGPTs Educational Impact ChatGPT Reshaping Education Sector ChatGPT SS
This slide represents statistical data showing impact of ChatGPT on education sector. It includes details related to ChatGPT 4s capability in passing wide range of AP and higher level exams. Deliver an outstanding presentation on the topic using this Statistical Analysis ChatGPTs Educational Impact ChatGPT Reshaping Education Sector ChatGPT SS Dispense information and present a thorough explanation of Exam Results, Estimated Percentile using the slides given. This template can be altered and personalized to fit your needs. It is also available for immediate download. So grab it now.
-
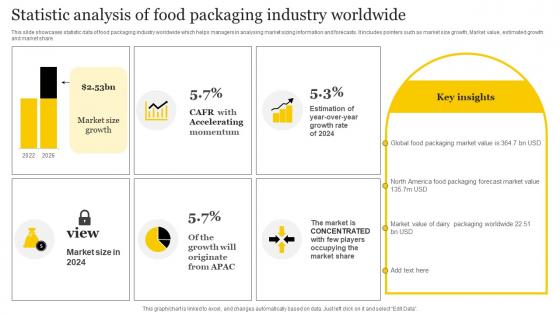 Statistic Analysis Of Food Packaging Industry Worldwide
This slide showcases statistic data of food packaging industry worldwide which helps managers in analysing market sizing information and forecasts. It includes pointers such as market size growth, Market value, estimated growth and market share. Introducing our Statistic Analysis Of Food Packaging Industry Worldwide set of slides. The topics discussed in these slides are Food Packaging, Industry Worldwide. This is an immediately available PowerPoint presentation that can be conveniently customized. Download it and convince your audience.
-
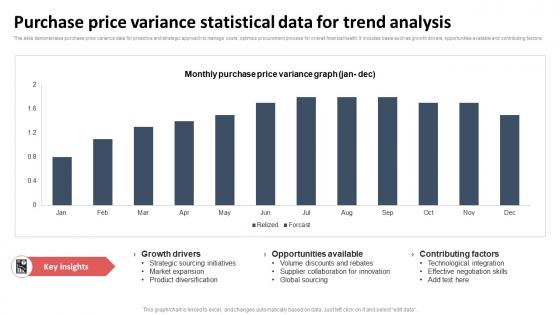 Purchase Price Variance Statistical Data For Trend Analysis
This slide demonstrates purchase price variance data for proactive and strategic approach to manage costs, optimize procurement process for overall financial health. It includes basis such as growth drivers, opportunities available and contributing factors. Introducing our Purchase Price Variance Statistical Data For Trend Analysis set of slides. The topics discussed in these slides are Monthly Purchase, Variance Graph, Trend Analysis This is an immediately available PowerPoint presentation that can be conveniently customized. Download it and convince your audience.
-
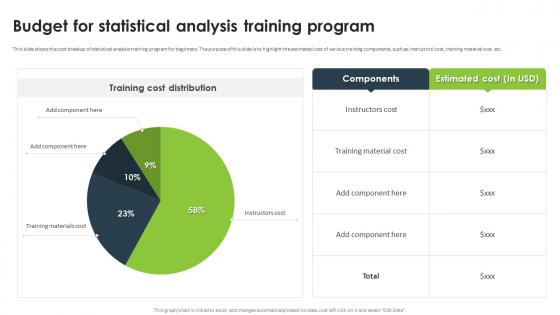 Statistical Analysis For Data Driven Budget For Statistical Analysis Training Program
This slide shows the cost breakup of statistical analysis training program for beginners. The purpose of this slide is to highlight the estimated cost of various training components, such as instructors cost, training material cost, etc. Present the topic in a bit more detail with this Statistical Analysis For Data Driven Budget For Statistical Analysis Training Program. Use it as a tool for discussion and navigation on Budget For Statistical Analysis, Training Program, Instructors Cost, Training Material Cost. This template is free to edit as deemed fit for your organization. Therefore download it now.
-
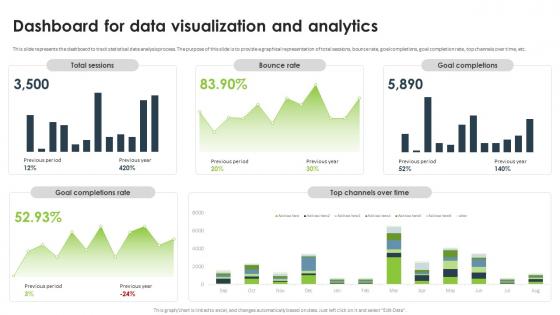 Statistical Analysis For Data Driven Dashboard For Data Visualization And Analytics
This slide represents the dashboard to track statistical data analysis process. The purpose of this slide is to provide a graphical representation of total sessions, bounce rate, goal completions, goal completion rate, top channels over time, etc. Present the topic in a bit more detail with this Statistical Analysis For Data Driven Dashboard For Data Visualization And Analytics. Use it as a tool for discussion and navigation on Data Visualization And Analytics, Bounce Rate, Goal Completions, Goal Completion Rate. This template is free to edit as deemed fit for your organization. Therefore download it now.
-
 Statistical Analysis For Data Driven Global Market Of Statistical Analysis Software
This slide depicts the forecast value of statistical analysis software market. The purpose of this slide is to highlight the expected contribution of different countries in global market of statistical data analysis software, such as North America, Europe, etc. Present the topic in a bit more detail with this Statistical Analysis For Data Driven Global Market Of Statistical Analysis Software. Use it as a tool for discussion and navigation on Statistical Analysis Software Market, Data Analysis Software, Global Market. This template is free to edit as deemed fit for your organization. Therefore download it now.
-
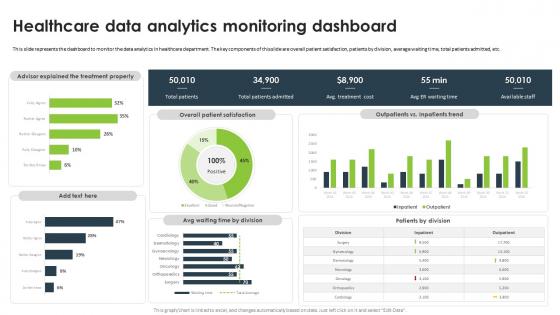 Statistical Analysis For Data Driven Healthcare Data Analytics Monitoring Dashboard
This slide represents the dashboard to monitor the data analytics in healthcare department. The key components of this slide are overall patient satisfaction, patients by division, average waiting time, total patients admitted, etc. Present the topic in a bit more detail with this Statistical Analysis For Data Driven Healthcare Data Analytics Monitoring Dashboard. Use it as a tool for discussion and navigation on Healthcare Data Analytics, Monitoring Dashboard, Healthcare Department. This template is free to edit as deemed fit for your organization. Therefore download it now.
-
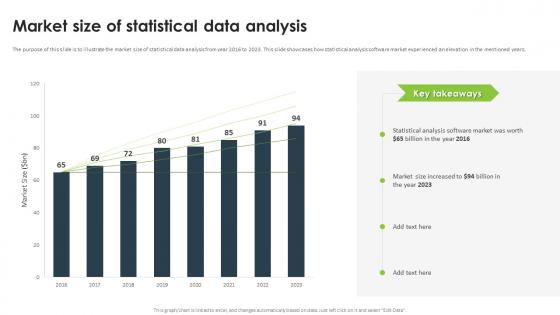 Statistical Analysis For Data Driven Market Size Of Statistical Data Analysis
The purpose of this slide is to illustrate the market size of statistical data analysis from year 2016 to 2023. This slide showcases how statistical analysis software market experienced an elevation in the mentioned years. Present the topic in a bit more detail with this Statistical Analysis For Data Driven Market Size Of Statistical Data Analysis. Use it as a tool for discussion and navigation on Statistical Data Analysis, Statistical Analysis Software, Market Experienced An Elevation. This template is free to edit as deemed fit for your organization. Therefore download it now.
-
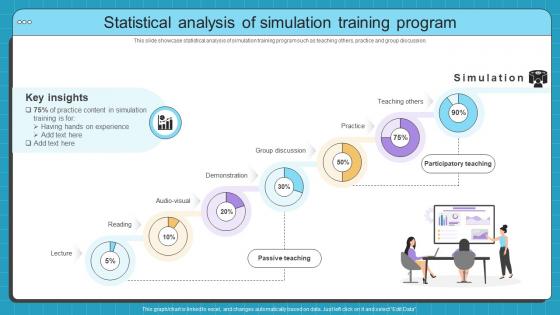 Statistical Analysis Of Simulation Simulation Based Training Program For Hands On Learning DTE SS
This slide showcase statistical analysis of simulation training program such as teaching others, practice and group discussion. Deliver an outstanding presentation on the topic using this Statistical Analysis Of Simulation Simulation Based Training Program For Hands On Learning DTE SS. Dispense information and present a thorough explanation of Group Discussion, Teaching Others, Participatory Teaching using the slides given. This template can be altered and personalized to fit your needs. It is also available for immediate download. So grab it now.
-
 Expertise Icon Business Statistical Analysis Professional Research
Introduce your topic and host expert discussion sessions with this Expertise Icon Business Statistical Analysis Professional Research. This template is designed using high-quality visuals, images, graphics, etc, that can be used to showcase your expertise. Different topics can be tackled using the ten slides included in this template. You can present each topic on a different slide to help your audience interpret the information more effectively. Apart from this, this PPT slideshow is available in two screen sizes, standard and widescreen making its delivery more impactful. This will not only help in presenting a birds-eye view of the topic but also keep your audience engaged. Since this PPT slideshow utilizes well-researched content, it induces strategic thinking and helps you convey your message in the best possible manner. The biggest feature of this design is that it comes with a host of editable features like color, font, background, etc. So, grab it now to deliver a unique presentation every time.
-
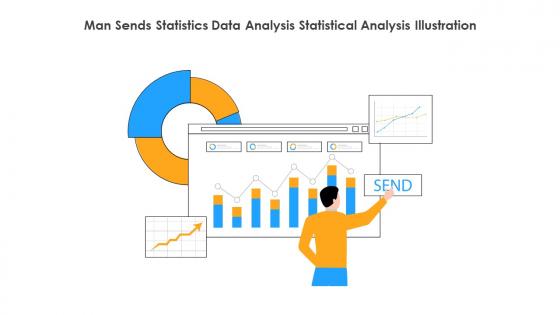 Man Sends Statistics Data Analysis Statistical Analysis Illustration
This coloured powerpoint icon is perfect for presentations on data analysis. It features a man in a suit holding a graph, representing the transmission of statistical information. It is a great visual aid to demonstrate the importance of data in decision making.
-
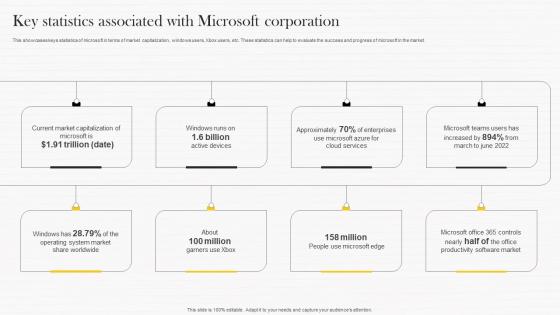 Key Statistics Associated With Microsoft Strategy Analysis To Understand Strategy Ss V
This showcases keys statistics of microsoft in terms of market capitalization, windows users, Xbox users, etc. These statistics can help to evaluate the success and progress of microsoft in the market. Increase audience engagement and knowledge by dispensing information using Key Statistics Associated With Microsoft Strategy Analysis To Understand Strategy SS V. This template helps you present information on eight stages. You can also present information on Market, Devices, Services using this PPT design. This layout is completely editable so personaize it now to meet your audiences expectations.
-
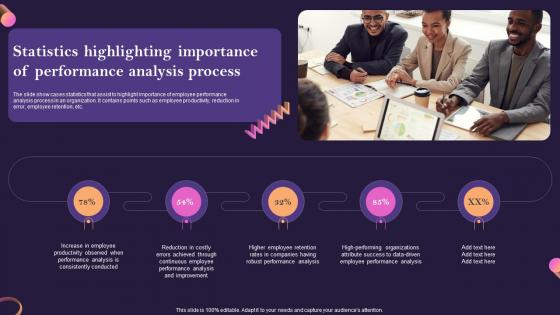 Statistics Highlighting Importance Of Performance Analysis Process
The slide show cases statistics that assist to highlight importance of employee performance analysis process in an organization. It contains points such as employee productivity, reduction in error, employee retention, etc. Presenting our set of slides with Statistics Highlighting Importance Of Performance Analysis Process. This exhibits information on five stages of the process. This is an easy to edit and innovatively designed PowerPoint template. So download immediately and highlight information on Increase In Employee, Higher Employee Retention.
-
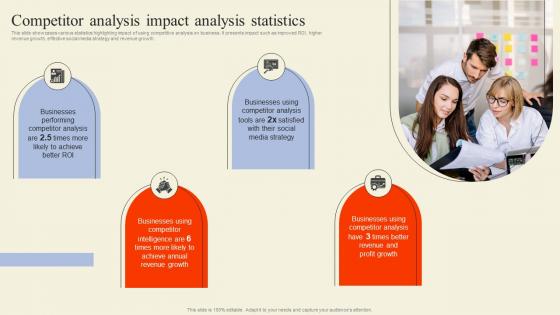 Competitor Analysis Impact Analysis Statistics Executing Competitor Analysis To Assess
This slide showcases various statistics highlighting impact of using competitive analysis on business. It presents impact such as improved ROI, higher revenue growth, effective social media strategy and revenue growth.Introducing Competitor Analysis Impact Analysis Statistics Executing Competitor Analysis To Assess to increase your presentation threshold. Encompassed with four stages, this template is a great option to educate and entice your audience. Dispence information on Businesses Performing, Competitor Analysis, Revenue Growth, using this template. Grab it now to reap its full benefits.
-
 Analysis Variance Statistical Method In Powerpoint And Google Slides Cpb
Presenting Analysis Variance Statistical Method In Powerpoint And Google Slides Cpb slide which is completely adaptable. The graphics in this PowerPoint slide showcase four stages that will help you succinctly convey the information. In addition, you can alternate the color, font size, font type, and shapes of this PPT layout according to your content. This PPT presentation can be accessed with Google Slides and is available in both standard screen and widescreen aspect ratios. It is also a useful set to elucidate topics like Analysis Variance Statistical Method. This well structured design can be downloaded in different formats like PDF, JPG, and PNG. So, without any delay, click on the download button now.
-
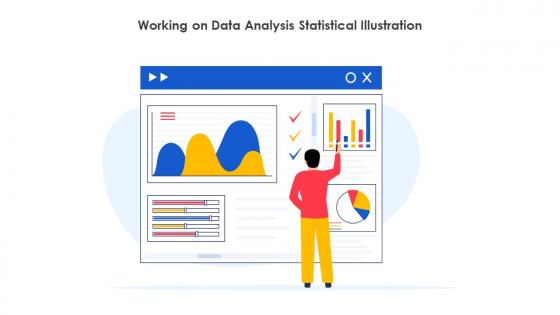 Working On Data Analysis Statistical Illustration
This colourful PowerPoint icon is perfect for presentations on working on analysis. It features a magnifying glass, a chart, and a pen, representing the process of researching and analysing data. Its a great visual aid to help explain your ideas.
-
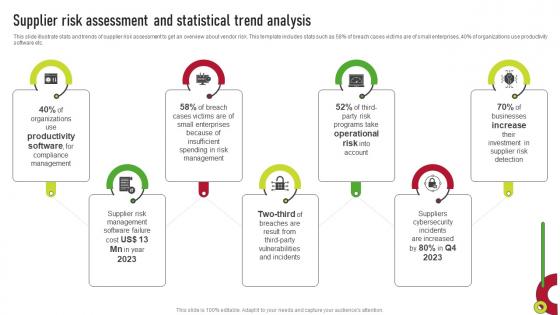 Supplier Risk Assessment And Statistical Trend Analysis Supplier Risk Management
This slide illustrate stats and trends of supplier risk assessment to get an overview about vendor risk. This template includes stats such as 58 percent of breach cases victims are of small enterprises, 40 percent of organizations use productivity software etc. Introducing Supplier Risk Assessment And Statistical Trend Analysis Supplier Risk Management to increase your presentation threshold. Encompassed with seven stages, this template is a great option to educate and entice your audience. Dispence information on Productivity Software, Operational Risk, Increase, using this template. Grab it now to reap its full benefits.
-
 Statistical Analysis in Business AI Image PowerPoint Presentation PPT ECS
Introducing a Visual PPT on Statistical Analysis in Business. Every slide in this PowerPoint is meticulously designed by our Presentation Experts. Modify the content as you see fit. Moreover, the PowerPoint Template is suitable for screens and monitors of all dimensions, and even works seamlessly with Google Slides. Download the PPT, make necessary changes, and present with confidence.
-
 Statistics for Business Analysis AI Image PowerPoint Presentation PPT ECS
Introducing a Visual PPT on Statistics for Business Analysis. Every slide in this PowerPoint is meticulously designed by our Presentation Experts. Modify the content as you see fit. Moreover, the PowerPoint Template is suitable for screens and monitors of all dimensions, and even works seamlessly with Google Slides. Download the PPT, make necessary changes, and present with confidence.
-
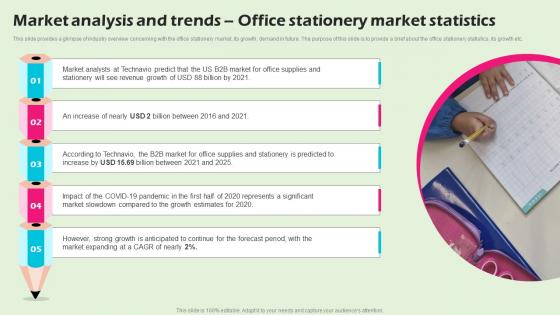 Market Analysis And Trends Office Stationery Market Statistics Stationery Business BP SS
This slide provides a glimpse of industry overview concerning with the office stationery market, its growth, demand in future. The purpose of this slide is to provide a brief about the office stationery statistics, its growth etc. Increase audience engagement and knowledge by dispensing information using Market Analysis And Trends Office Stationery Market Statistics Stationery Business BP SS. This template helps you present information on five stages. You can also present information on Market Analysts, However, Strong Growth using this PPT design. This layout is completely editable so personaize it now to meet your audiences expectations.
-
 Statistics Sales Analysis In Powerpoint And Google Slides Cpb
Presenting our Statistics Sales Analysis In Powerpoint And Google Slides Cpb PowerPoint template design. This PowerPoint slide showcases four stages. It is useful to share insightful information on Statistics Sales Analysis. This PPT slide can be easily accessed in standard screen and widescreen aspect ratios. It is also available in various formats like PDF, PNG, and JPG. Not only this, the PowerPoint slideshow is completely editable and you can effortlessly modify the font size, font type, and shapes according to your wish. Our PPT layout is compatible with Google Slides as well, so download and edit it as per your knowledge.
-
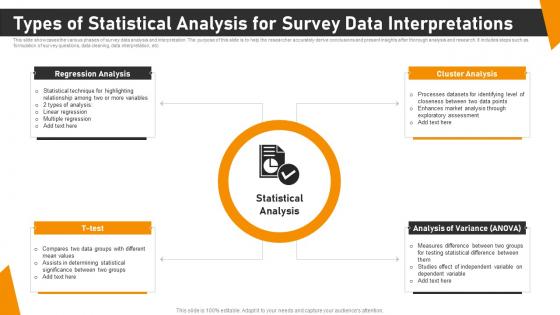 Types Of Statistical Analysis For Survey Data Interpretations
This slide showcases the various phases of survey data analysis and interpretation. The purpose of this slide is to help the researcher accurately derive conclusions and present insights after thorough analysis and research. It includes steps such as formulation of survey questions, data cleaning, data interpretation, etc. Presenting our set of slides with Types Of Statistical Analysis For Survey Data Interpretations. This exhibits information on four stages of the process. This is an easy to edit and innovatively designed PowerPoint template. So download immediately and highlight information on Regression Analysis, Cluster Analysis, Analysis Variance.
-
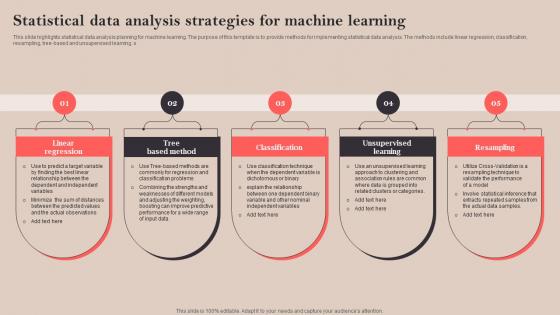 Statistical Data Analysis Strategies For Machine Learning
This slide highlights statistical data analysis planning for machine learning. The purpose of this template is to provide methods for implementing statistical data analysis. The methods include linear regression, classification, resampling, tree-based and unsupervised learning. Introducing our premium set of slides with Statistical Data Analysis Strategies For Machine Learning. Ellicudate the five stages and present information using this PPT slide. This is a completely adaptable PowerPoint template design that can be used to interpret topics like Linear Regression, Tree Based Method, Classification. So download instantly and tailor it with your information.
-
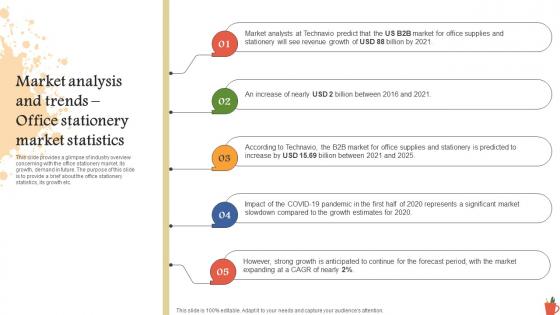 Market Analysis And Trends Office Stationery Market Statistics Consumer Stationery Business BP SS
This slide provides a glimpse of industry overview concerning with the office stationery market, its growth, demand in future. The purpose of this slide is to provide a brief about the office stationery statistics, its growth etc. Increase audience engagement and knowledge by dispensing information using Market Analysis And Trends Office Stationery Market Statistics Consumer Stationery Business BP SS. This template helps you present information on five stages. You can also present information on Market Analysts, Technavio Predict using this PPT design. This layout is completely editable so personaize it now to meet your audiences expectations.
-
 Statistical Analysis Calculator In Powerpoint And Google Slides Cpb
Presenting Statistical Analysis Calculator In Powerpoint And Google Slides Cpb slide which is completely adaptable. The graphics in this PowerPoint slide showcase five stages that will help you succinctly convey the information. In addition, you can alternate the color, font size, font type, and shapes of this PPT layout according to your content. This PPT presentation can be accessed with Google Slides and is available in both standard screen and widescreen aspect ratios. It is also a useful set to elucidate topics like Statistical Analysis Calculator. This well structured design can be downloaded in different formats like PDF, JPG, and PNG. So, without any delay, click on the download button now.
-
 A108 Statistics Highlighting Business Key Information Competitor Analysis Guide To Develop MKT SS V
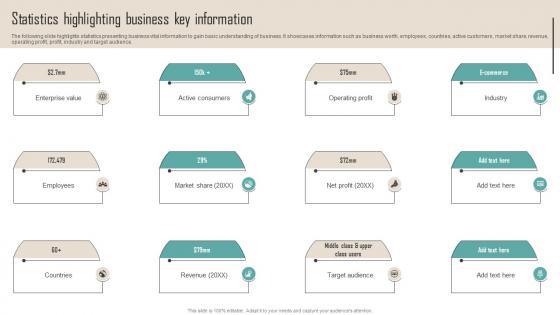
The following slide highlights statistics presenting business vital information to gain basic understanding of business. It showcases information such as business worth, employees, countries, active customers, market share, revenue, operating profit, profit, industry and target audience. Introducing A108 Statistics Highlighting Business Key Information Competitor Analysis Guide To Develop MKT SS V to increase your presentation threshold. Encompassed with one stages, this template is a great option to educate and entice your audience. Dispence information on Statistics, Business, Information, using this template. Grab it now to reap its full benefits.
-
 Statistics Highlighting Demand For Data Driven Decision Making Marketing Data Analysis MKT SS V
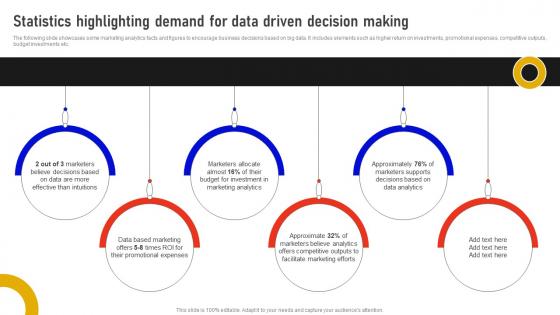
The following slide showcases some marketing analytics facts and figures to encourage business decisions based on big data. It includes elements such as higher return on investments, promotional expenses, competitive outputs, budget investments etc. Introducing Statistics Highlighting Demand For Data Driven Decision Making Marketing Data Analysis MKT SS V to increase your presentation threshold. Encompassed with six stages, this template is a great option to educate and entice your audience. Dispence information on Based Marketing, Marketing Analytics, Data Analytics using this template. Grab it now to reap its full benefits.
-
 Statistics Showing Rising Scope For Marketing Analytics Marketing Data Analysis MKT SS V
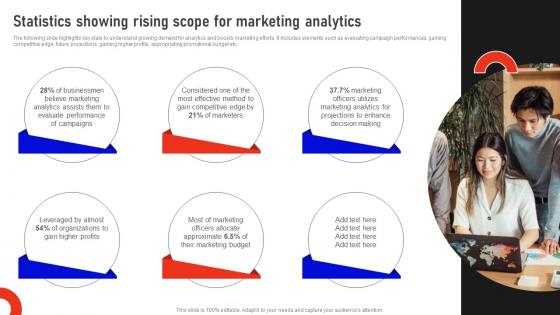
The following slide highlights key stats to understand growing demand for analytics and boosts marketing efforts. It includes elements such as evaluating campaign performances, gaining competitive edge, future projections, gaining higher profits, appropriating promotional budget etc. Increase audience engagement and knowledge by dispensing information using Statistics Showing Rising Scope For Marketing Analytics Marketing Data Analysis MKT SS V This template helps you present information on six stages. You can also present information on Businessmen, Marketing Budget, Decision Making using this PPT design. This layout is completely editable so personaize it now to meet your audiences expectations.
-
 I225 Market Analysis And Trends Office Stationery Market Statistics Sample Office Depot BP SS
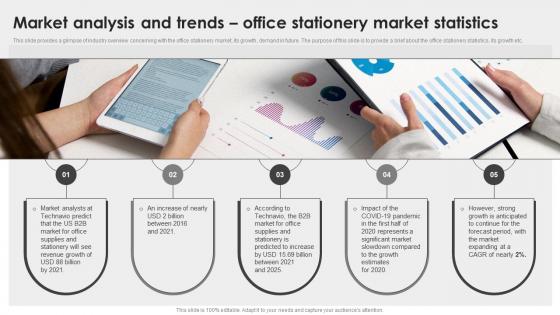
This slide provides a glimpse of industry overview concerning with the office stationery market, its growth, demand in future. The purpose of this slide is to provide a brief about the office stationery statistics, its growth etc. Increase audience engagement and knowledge by dispensing information using I225 Market Analysis And Trends Office Stationery Market Statistics Sample Office Depot BP SS. This template helps you present information on five stages. You can also present information on Market Analysts, Increase Of Nearly using this PPT design. This layout is completely editable so personaize it now to meet your audiences expectations.
-
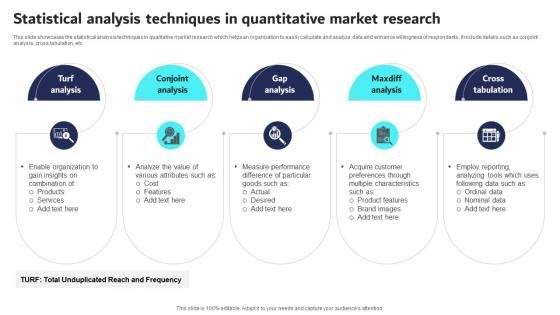 Statistical Analysis Techniques In Quantitative Market Research
This slide showcases the statistical analysis techniques in qualitative market research which helps an organization to easily calculate and analyze data and enhance willingness of respondents. It include details such as conjoint analysis, cross tabulation, etc. Presenting our set of slides with Statistical Analysis Techniques In Quantitative Market Research. This exhibits information on five stages of the process. This is an easy to edit and innovatively designed PowerPoint template. So download immediately and highlight information on Turf Analysis, Conjoint Analysis.
-
 Statistical Analysis Plan In Powerpoint And Google Slides Cpb
Presenting Statistical Analysis Plan In Powerpoint And Google Slides Cpb slide which is completely adaptable. The graphics in this PowerPoint slide showcase three stages that will help you succinctly convey the information. In addition, you can alternate the color, font size, font type, and shapes of this PPT layout according to your content. This PPT presentation can be accessed with Google Slides and is available in both standard screen and widescreen aspect ratios. It is also a useful set to elucidate topics like Statistical Analysis Plan. This well structured design can be downloaded in different formats like PDF, JPG, and PNG. So, without any delay, click on the download button now.
-
 Confidence Interval Statistical Analysis In Powerpoint And Google Slides Cpb
Presenting Confidence Interval Statistical Analysis In Powerpoint And Google Slides Cpb slide which is completely adaptable. The graphics in this PowerPoint slide showcase three stages that will help you succinctly convey the information. In addition, you can alternate the color, font size, font type, and shapes of this PPT layout according to your content. This PPT presentation can be accessed with Google Slides and is available in both standard screen and widescreen aspect ratios. It is also a useful set to elucidate topics like Confidence Interval Statistical Analysis. This well structured design can be downloaded in different formats like PDF, JPG, and PNG. So, without any delay, click on the download button now.
-
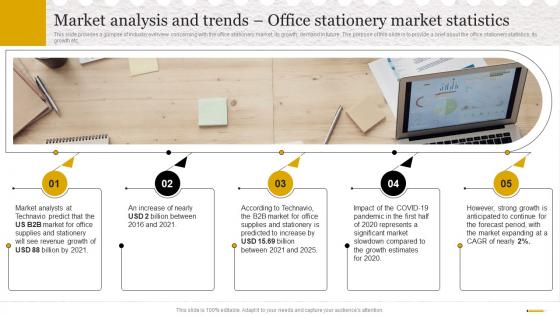 Stationery Business Plan Market Analysis And Trends Office Stationery Market Statistics BP SS
This slide provides a glimpse of industry overview concerning with the office stationery market, its growth, demand in future. The purpose of this slide is to provide a brief about the office stationery statistics, its growth etc. Increase audience engagement and knowledge by dispensing information using Stationery Business Plan Market Analysis And Trends Office Stationery Market Statistics BP SS. This template helps you present information on five stages. You can also present information on Office Stationery Market, Demand In Future, Market Analysis And Trends, Office Stationery Market Statistics using this PPT design. This layout is completely editable so personaize it now to meet your audiences expectations.
-
 Frequency Distribution Statistical Analysis In Powerpoint And Google Slides Cpb
Presenting Frequency Distribution Statistical Analysis In Powerpoint And Google Slides Cpb slide which is completely adaptable. The graphics in this PowerPoint slide showcase three stages that will help you succinctly convey the information. In addition, you can alternate the color, font size, font type, and shapes of this PPT layout according to your content. This PPT presentation can be accessed with Google Slides and is available in both standard screen and widescreen aspect ratios. It is also a useful set to elucidate topics like Frequency Distribution Statistical Analysis. This well structured design can be downloaded in different formats like PDF, JPG, and PNG. So, without any delay, click on the download button now.
-
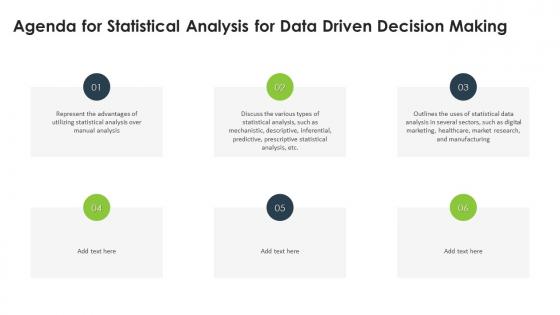 Agenda For Statistical Analysis For Data Driven Decision Making
Introducing Agenda For Statistical Analysis For Data Driven Decision Making to increase your presentation threshold. Encompassed with six stages, this template is a great option to educate and entice your audience. Dispence information on Statistical Analysis, Data Driven Decision Making, Healthcare, Market Research, using this template. Grab it now to reap its full benefits.


