Being a sales professional can be challenging, but the rewards are worth it. You work hard and play harder, and since you are often at the frontlines of a business’s growth, you are considered an integral player in your company's story and culture. Your mission is clear: Driving business growth and achieving revenue goals.
You, however, cannot deny that your secret to success lies in the wealth of quality data at your fingertips. You leverage this data to boost seller productivity and drive innovation. To ensure that you take full advantage of the potential of this data, you need a sales analysis reporting tool.
Sales data includes a wide array of metrics. It’s crucial to learn how to read it to understand what it means for your business and where you can improve. With the right sales analysis report tools, you’ll have a wealth of information, spot trends that empower you and your team, and provide better sales forecasts and goals for the rest of the organization. This is where SlideTeam’s Sales Analysis Report Templates come into the picture.
Sales Analysis Report Templates for Business Performance Evaluation
Using sales analysis report templates, you can evaluate sales performance, make informed decisions, and drive sales growth. Also, these templates work as the perfect tool for communicating reports, strategies, and plans to build a dedicated and informed sales team.
The best part about SlideTeam’s Sales Analysis Report Templates is that the 100% editable and customizable nature of the templates provides you with the desired flexibility to edit your presentations. The content-ready slides give you the much-needed structure.
Let’s begin exploring these PowerPoint Templates one by one!
Template 1: Sales and Marketing Analysis Report Template
Use this PowerPoint presentation to provide insights into your company’s sales and marketing efforts. It includes graphics-packed slides on the monthly calendar, performance reporting, region and product-wise performance, key financials, deliverables with timelines, and much more. Showcase ROI, marketing roadmap, and website performance with feature-packed templates that will make communicating your report easier. This comprehensive deck encompasses crucial parameters for analyzing your business's online and offline performance. Grab it now!
Template 2: Sales Performance Reporting Template
Sales analysis reporting includes tracking sales performance, identifying customer behavior trends, and evaluating marketing strategies. Using this template, you can ace this process in no time. Leverage the visuals of this slide to highlight the top selling plans, sales goal YTD, and new customer acquisition to understand what worked for your business. Also, showcase your top sales reps, top opportunities, and sales funnel in a compelling way. Download it now!
Template 3: Key Deliverables and Timeline Template
In sales analysis, key deliverables and timelines include completing specific tasks or objectives within a certain time frame. It may include financial reports, market research data, customer feedback, and sales forecasts. Sales managers can use this PPT Slide to communicate time spent on activities like budgeting, registration, collateral preparations, and more for events. This layout includes a seven-week timeline. You can modify it as per your sales team’s deliverables and timeline. Grab it now!
Template 4: Product-wise Performance Report Template
Use this PPT Slide to provide insights into the performance of specific products within your business portfolio. You can identify growth trends, identify areas for improvement, and make data-driven decisions about product strategy, pricing, and promotions. Here, include metrics like revenue, market share, sales volume, and profit margins and showcase them using curve graphs and donut charts. Use this report to compare product performance over time, across regions, or against competitors. Download now!
Template 5: Website Performance Review Template
Use this PPT Dashboard to evaluate the performance of your website and analyze aspects such as visits, conversion rate, average visit value, and top converting goals. It includes easy-to-understand graphics such as bar graphs, pie charts, curve charts, and a speedometer diagram to help you convey the report at a glance. With this information, you can make informed decisions on how to improve the website's performance. This PPT Slide is a helpful tool for webmasters, marketers, and every business owner. Download now to monitor and improve your website's performance over time.
Template 6: Search Engines Ranking Report Template
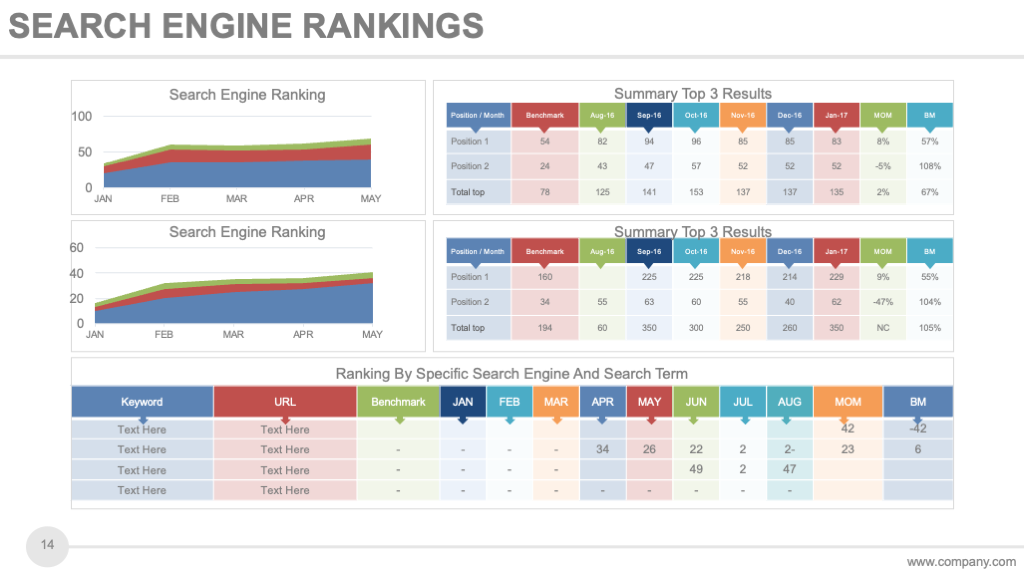
Here, we present a comprehensive layout that will help you present the search engine rankings of your website and its pages. Use it to provide insights into your website’s ranking on search engines for specific search terms or keywords. You can use it to report your search engine rankings for a specified period of time, such as a week, a month, or a year. Download it now to convey the result your search engine optimization efforts have yielded.
Template 7: Email Marketing Report Template
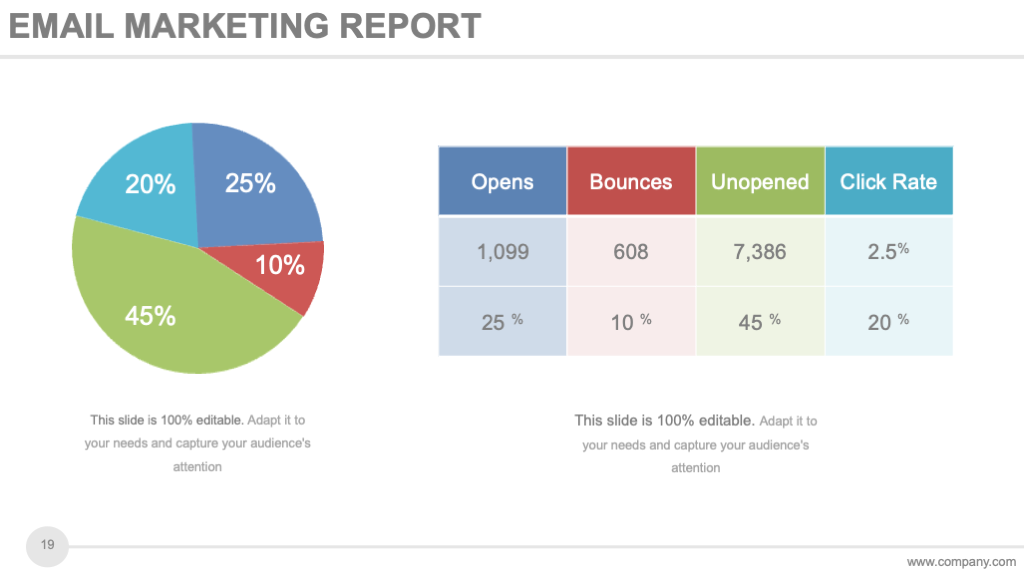
If you don’t track email marketing efficacy, you won't know the proportion of people who opened or read your most recent email, what percentage visited your website, redeemed the offer, or made a purchase. Use this PPT Template to showcase your email campaign’s open rate, bounce rate, unopened numbers, and click rate. This template gives you a clearer understanding of email campaign performances and what needs to be done to maximize your campaign’s ROI. For campaign managers, this is one of the best resources that can assist in making strategic decisions for future campaigns. Download now!
Template 8: Monthly Pipeline Summary
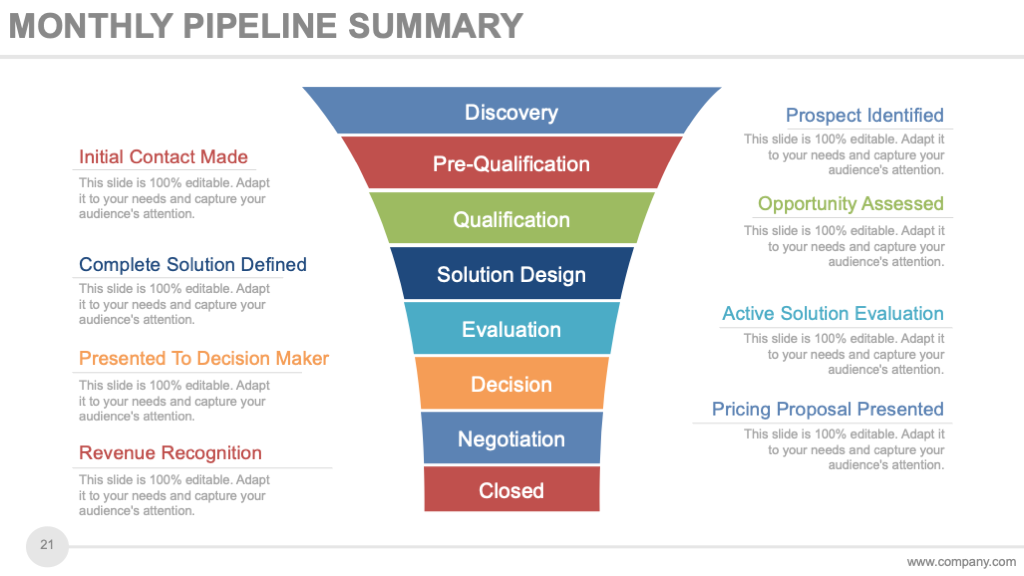
Use this PowerPoint Slide to provide an overview of your company's sales pipeline for a specific month. You can also showcase information on the sales cycle stage of each deal and identify potential bottlenecks in the sales process. The pipeline here begins from the discovery stage, then showcases pre-qualification, qualification, solution design, evaluation, decision, and negotiation, and ends with closing the deal. Download today to make data-driven decisions to boost sales performance.
Template 9: Social Media Metrics Report Template
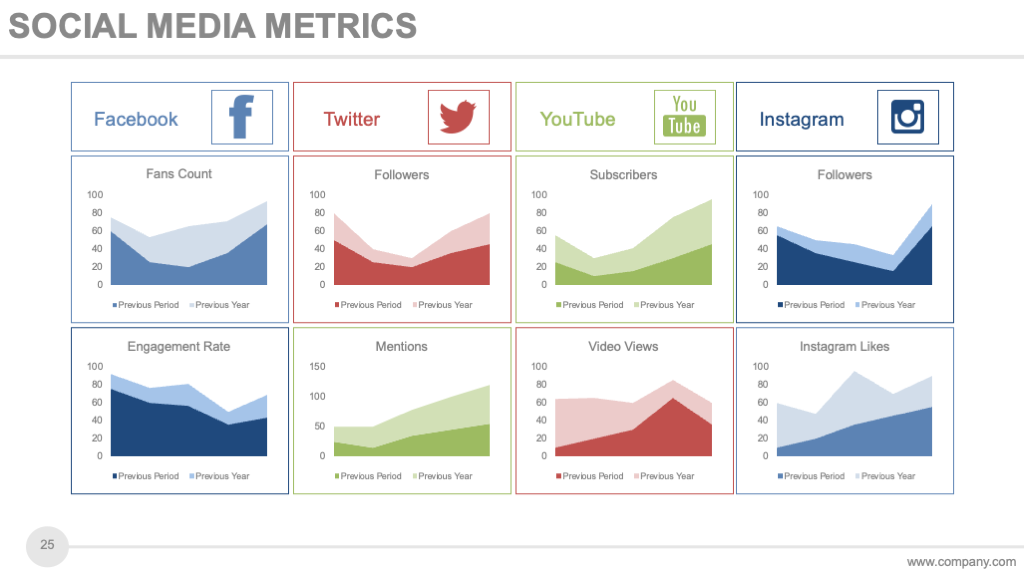
Outline key metrics to track and analyze for a social media campaign on platforms like Facebook, Twitter, YouTube, and Instagram with this PPT Slide. This template includes information on the number of fans, followers, subscribers, engagement rate, mentions, likes, and views. It is designed to help marketers evaluate the success of their social media campaigns and identify gaps and areas for improvement. Download it today to ensure your social media becomes more popular and reaches a wider audience.
Template 10: Last 30 Days Results Template
Showcase the analytics of your last 30 days using this feature-packed dashboard. It highlights sales comparisons, sales by products, and months to help you understand the growth of the business. Present your brand profitability, revenue percentage change, new customer acquisition rates, and gross profit at a glance. Also, it lets you highlight the customer satisfaction level as compared to the trend. Isn’t it convenient to use this slide while you are busy focusing on more priorities? Grab it today!
Key to Easy Reporting
Sales analysis reporting templates help organizations track success and make informed decisions about their sales strategies. These can be configured to give insights into market trends, customer behavior, and product performance. With continuous evaluation and review of sales data, enterprises can reach out to prospects for expansion and maximized revenue. For stakeholders who need a clear and succinct summary of the company's sales performance, both internally and externally, a well-designed sales analysis reporting template can be of benefit.
Now that you have access to the most popular Sales Analysis Report Templates, download them to get started on creating practical reports that your audience will resonate with.




 Customer Reviews


