Data Visualization Powerpoint Presentation Slides
Visualization research creates tools to aid in the exploratory analysis process and expands our knowledge of how visuals assist in data interpretation. Check out our competently designed Data Visualization template that gives a brief idea about the current situation in the organization its existing issues to understand the need for visualization research. In this Visualization Research PowerPoint Presentation, we have covered the importance of visualization research. In addition, this PPT contains an introduction to visualization research and its branches, such as scientific, information visualization, and visual analytics. Furthermore, this Visualization research template includes the overview of different analyses for data visualization, use cases, and the tools and software for visualization. Lastly, this deck comprises a 30-60-90 days plan, roadmap, sales performance dashboard, and impact of visualization research implementation in the organization. Download our 100 percent editable and customizable template, which is also compatible with Google slides. Download it now.
You must be logged in to download this presentation.
PowerPoint presentation slides
Enthrall your audience with this Data Visualization Powerpoint Presentation Slides. Increase your presentation threshold by deploying this well-crafted template. It acts as a great communication tool due to its well-researched content. It also contains stylized icons, graphics, visuals etc, which make it an immediate attention-grabber. Comprising fourty seven slides, this complete deck is all you need to get noticed. All the slides and their content can be altered to suit your unique business setting. Not only that, other components and graphics can also be modified to add personal touches to this prefabricated set.
People who downloaded this PowerPoint presentation also viewed the following :
Content of this Powerpoint Presentation
Slide 1: This slide introduces Data Visualization. State your company name and begin.
Slide 2: This slide states Agenda of the presentation.
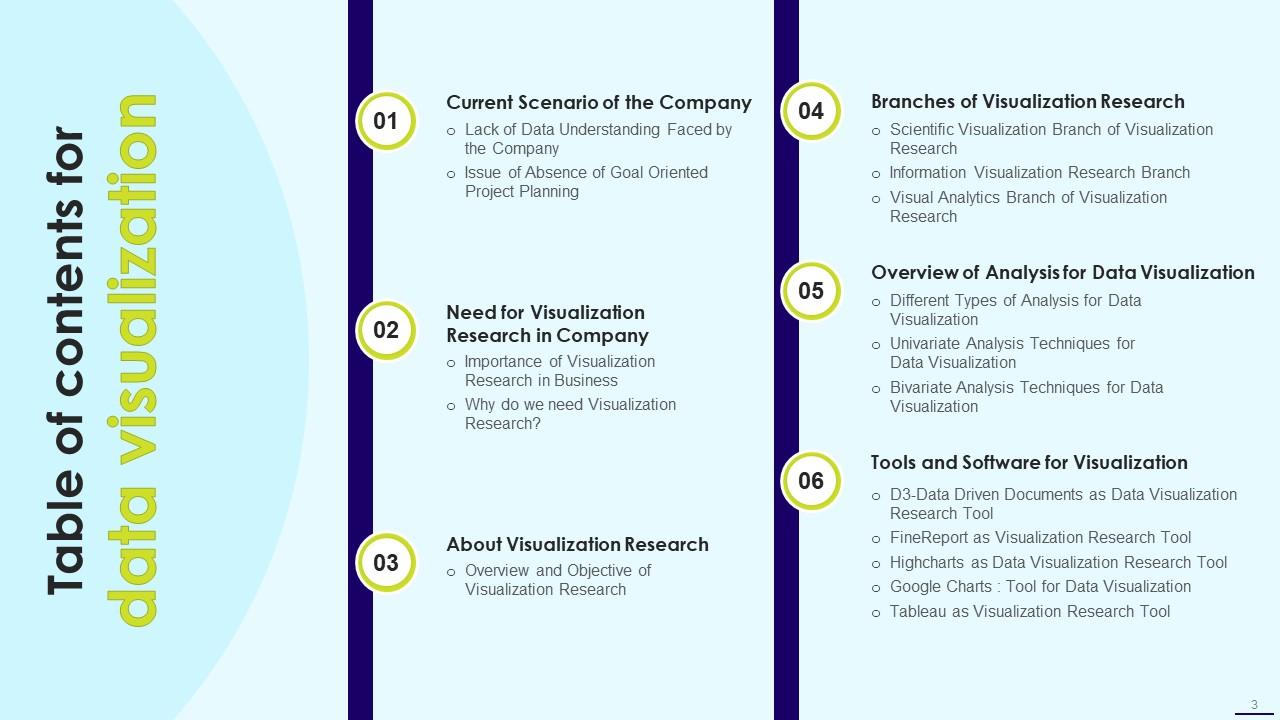
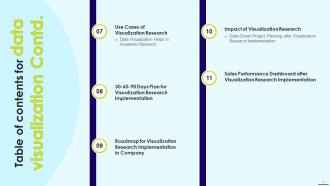
Slide 3: This slide presents Table of Content for the presentation.
Slide 4: This is another slide continuing Table of Content for the presentation.
Slide 5: This slide shows title for topics that are to be covered next in the template.
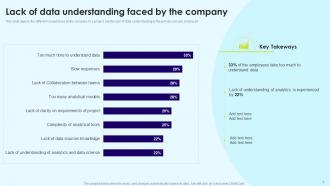
Slide 6: This slide depicts the different issues faced by the company in a project.
Slide 7: This slide displays Issue of Absence of Goal Oriented Project Planning.
Slide 8: This slide shows title for topics that are to be covered next in the template.
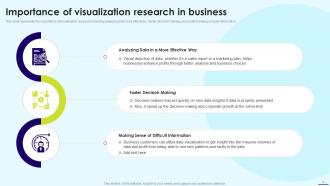
Slide 9: This slide represents Importance of Visualization Research in Business.
Slide 10: This slide depicts the need for visualization research, including assist in dealing with complex data.
Slide 11: This slide shows title for topics that are to be covered next in the template.
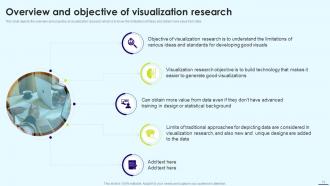
Slide 12: This slide represents Overview and Objective of Visualization Research.
Slide 13: This slide shows title for topics that are to be covered next in the template.
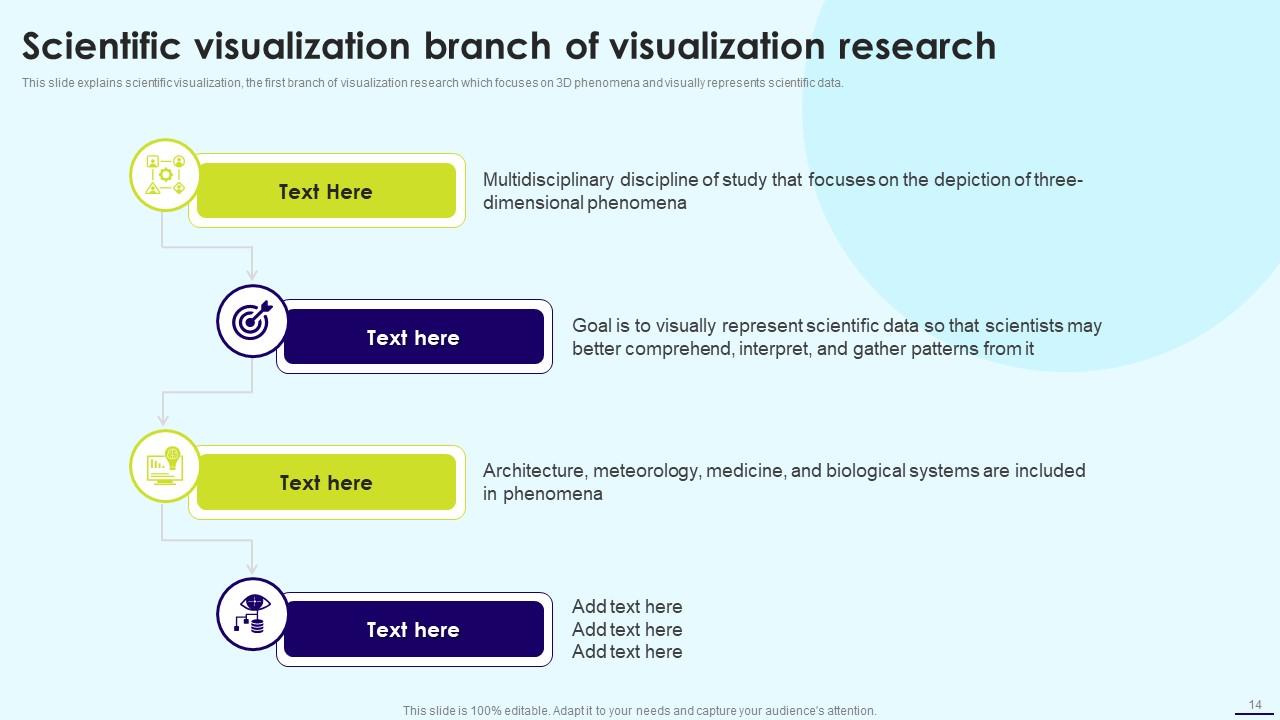
Slide 14: This slide showcases Scientific Visualization Branch of Visualization Research.
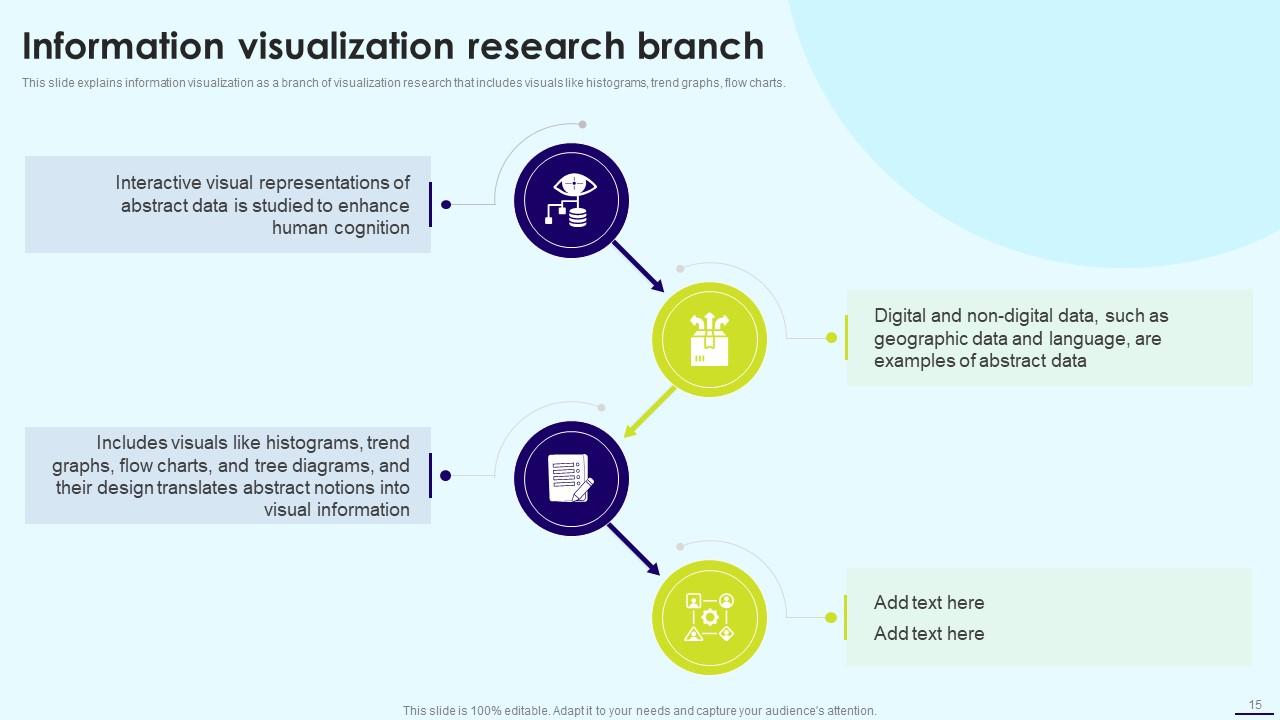
Slide 15: This slide explains information visualization as a branch of visualization research.
Slide 16: This slide shows visual analytics, the last branch of visualization research, which emerged from the advancements in the other two branches.
Slide 17: This slide shows title for topics that are to be covered next in the template.
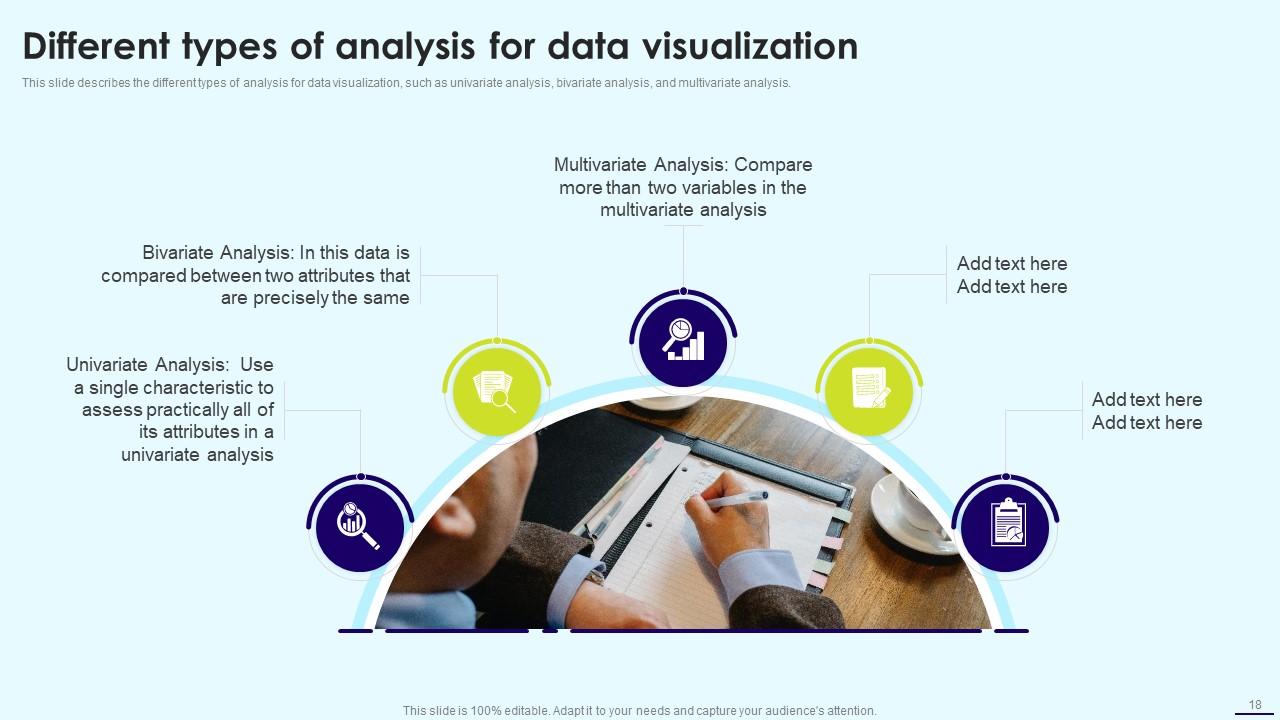
Slide 18: This slide presents Different Types of Analysis for Data Visualization.
Slide 19: This slide depicts the univariate analysis technique for data visualization.
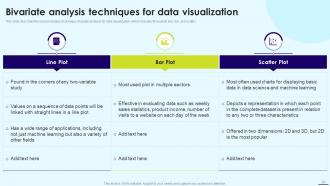
Slide 20: This slide describes the second analysis technique, bivariate analysis for data visualization.
Slide 21: This slide shows title for topics that are to be covered next in the template.
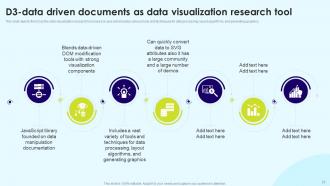
Slide 22: This slide depicts the D3 as the data visualization research tool based on java.
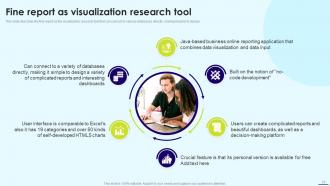
Slide 23: This slide describes the fine report as the visualization research tool that can connect to various databases.
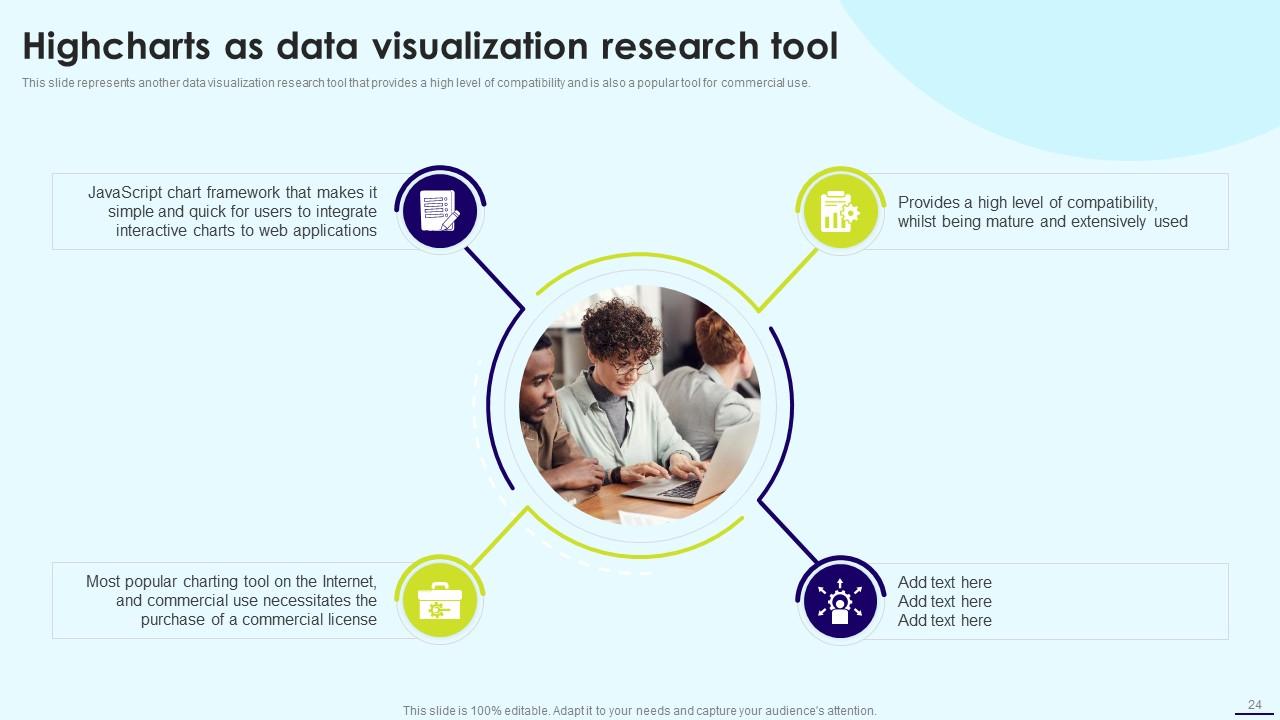
Slide 24: This slide showcases Highcharts as Data Visualization Research Tool.
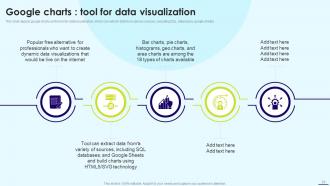
Slide 25: This slide depicts google charts as the tool for data visualization, which can extract data from various sources.
Slide 26: This slide shows the tableau visualization research tool in which users can construct and share interactive and editable dashboards.
Slide 27: This slide shows title for topics that are to be covered next in the template.
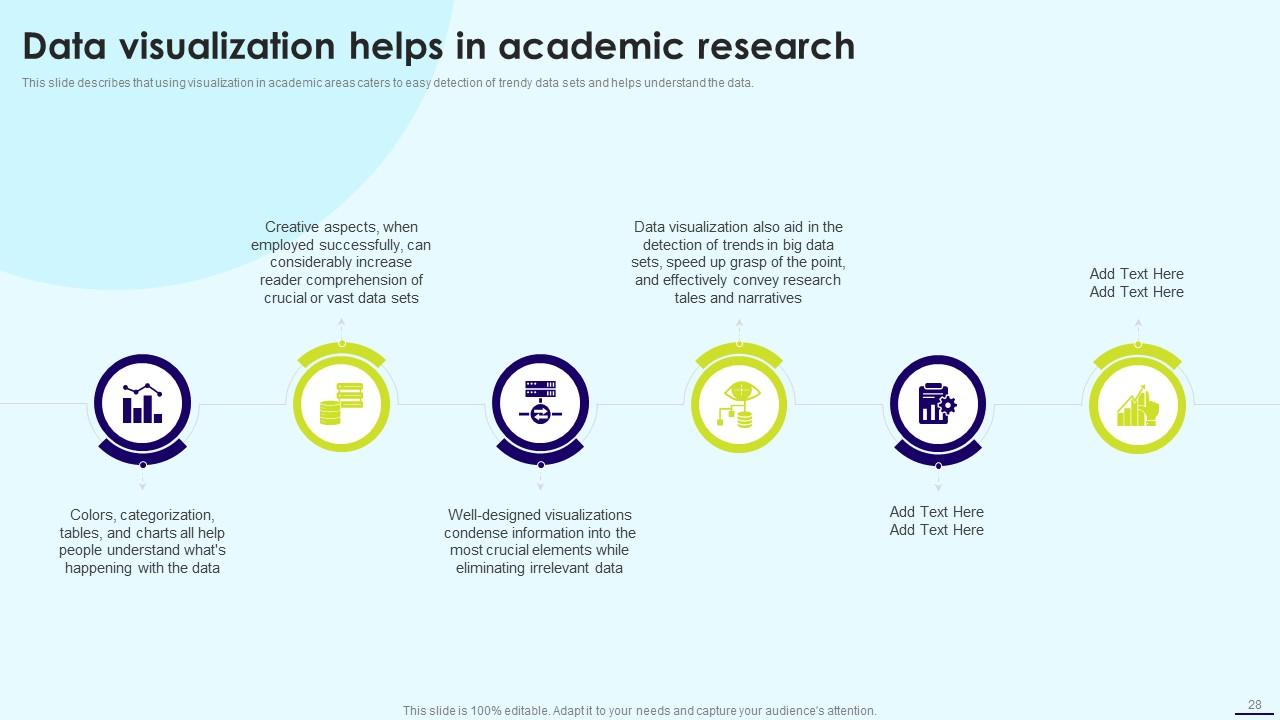
Slide 28: This slide represents Data Visualization Helps in Academic Research.
Slide 29: This slide shows title for topics that are to be covered next in the template.
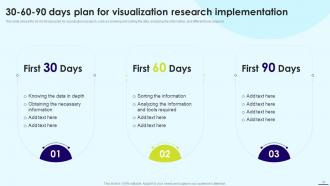
Slide 30: This slide displays 30-60-90 Days Plan for Visualization Research Implementation.
Slide 31: This slide shows title for topics that are to be covered next in the template.
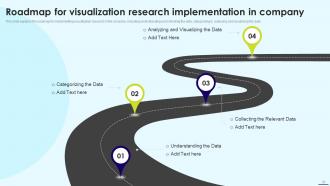
Slide 32: This slide presents Roadmap for Visualization Research Implementation in Company.
Slide 33: This slide shows title for topics that are to be covered next in the template.
Slide 34: This slide showcases Data-Driven Project Planning after Visualization Research Implementation.
Slide 35: This slide shows title for topics that are to be covered next in the template.
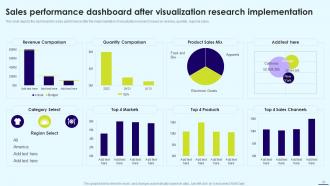
Slide 36: This slide presents Sales Performance Dashboard after Visualization Research Implementation.
Slide 37: This slide contains all the icons used in this presentation.
Slide 38: This slide is titled as Additional Slides for moving forward.
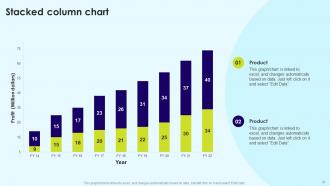
Slide 39: This slide represent Stacked column chart with two products comparison.
Slide 40: This slide contains Puzzle with related icons and text.
Slide 41: This slide shows Post It Notes. Post your important notes here.
Slide 42: This slide shows Circular Diagram with additional textboxes.
Slide 43: This is Our Target slide. State your targets here.
Slide 44: This slide depicts Venn diagram with text boxes.
Slide 45: This slide displays Mind Map with related imagery.
Slide 46: This is a Timeline slide. Show data related to time intervals here.
Slide 47: This is a Thank You slide with address, contact numbers and email address.
Data Visualization Powerpoint Presentation Slides with all 52 slides:
Use our Data Visualization Powerpoint Presentation Slides to effectively help you save your valuable time. They are readymade to fit into any presentation structure.
FAQs
Visualization research helps in dealing with complex data, making it easier to understand and analyze.
The three branches of visualization research are scientific visualization, information visualization, and visual analytics.
The two main types of analysis for data visualization are univariate and bivariate analysis.
Some popular data visualization research tools include D3, FineReport, Highcharts, Google Charts, and Tableau.
Visualization research can help in academic research by making it easier to analyze and present data, leading to better understanding and insights.
-
Their designing team is so expert in making tailored templates. They craft the exact thing I have in my mind…..really happy.
-
SlideTeam makes creating presentations easy. Unlimited products, premium quality designs and affordable.


