


Data Mining Powerpoint Presentation Slides




Try Before you Buy Download Free Sample Product
 Impress Your
 Audience
 100%
100% Editable
 Save Hours
 of Time


Data mining combines domain experience, computer abilities, and mathematical and statistical understanding to extract valuable insights from data. Here is a professionally designed Data Mining template that will greatly assist companies in presenting an overview of their current scenario and assessing the need for data mining adoption. Further, this data mining module showcases the gap analysis of the company and the introduction of data mining. In addition, it contains information on the requirements for the data mining adoption, the life cycle and phases of data mining, and critical components of the data mining. Furthermore, this data mining template includes the data mining tools such as SAS, Apache Spark, Excel, Tableau, NLP, and Tensor Flow, along with data mining in decision making. Moreover, this module highlights the difference between data mining and other tools, data mining workflow, job roles in data mining, and top data mining applications such as healthcare, logistic, finance, airlines, and business. Lastly, this template comprises a dashboard and impacts of the data mining integration on the organization. Download it now.
People who downloaded this PowerPoint presentation also viewed the following :
Content of this Powerpoint Presentation
Slide 1: This slide introduces Data Mining. State Your Company Name and begin.
Slide 2: This is an Agenda slide. State your agendas here.
Slide 3: This slide shows Table of Content for the presentation.
Slide 4: This is another slide continuing Table of Content for the presentation.
Slide 5: This slide highlights title for topics that are to be covered next in the template.
Slide 6: This slide presents current situation of our business by displaying the ratio of unstructured and structured data stored in the database.
Slide 7: This slide shows how unstructured data is causing challenges and how data science will help provide solutions.
Slide 8: This slide highlights title for topics that are to be covered next in the template.
Slide 9: This slide represents the need of the data science in the organization.
Slide 10: This slide shows Benefits of Data Mining to the Organization.
Slide 11: This slide presents the role of data Mining in decision making, and it includes collection & acquisition, storage, cleaning of data, etc.
Slide 12: This slide highlights title for topics that are to be covered next in the template.
Slide 13: This slide displays the prerequisites for data Mining that include knowledge of machine learning, modeling, statistic, database, and programming languages.
Slide 14: This slide represents Data Scientist Must Have Skills Before Implementing Data Science.
Slide 15: This is another slide showing Data Scientist must have Skills before Implementing Data Science.
Slide 16: This slide highlights title for topics that are to be covered next in the template.
Slide 17: This slide describes the life cycle of data science, which includes the stages such as predefined business problems, information acquisition, etc.
Slide 18: This slide displays the first phase of data science that is understanding business problems and the facts that come under this phase.
Slide 19: This slide represents the data preparation phase of data science, including its various stages such as raw data, structure data, data preprocessing, EDA, etc.
Slide 20: This slide shows Information Acquisition in Data Preparation Phase.
Slide 21: This slide presents model planning phase in data science and shows its tools, such as SQL Analysis Service, R, and SAS/ACCESS.
Slide 22: This slide shows exploratory data analysis in the model planning phase of data science and its various stages and reasons.
Slide 23: This slide displays various tools that could help in data modeling such as SAS enterprise miner, SPCS modeler, MATLAB, etc.
Slide 24: This slide represents operational phase of data science and what tasks are performed in this phase.
Slide 25: This slide shows last phase of the data science and in this phase, all the key findings are communicated to stakeholders.
Slide 26: This slide presents how data scientists throughout the project manage data till completion.
Slide 27: This slide highlights title for topics that are to be covered next in the template.
Slide 28: This slide displays top tools that are used in data science which include SAS, Apache Spark, Excel, etc.
Slide 29: This slide represents Statistical Analysis System used in data science for data management and modeling.
Slide 30: This slide shows Apache Spark tool used in data science and its features such as speed, reusability, advanced analytics, etc.
Slide 31: This slide presents excel tool used in data science and its usage along with its features.
Slide 32: This slide shows tool used in data science and its features such as licensing views, subscription of others, etc.
Slide 33: This slide displays Tools for Data Science- Natural Language Toolkit (NLTK).
Slide 34: This slide represents TensorFlow tool used in Data Science, and its features include flexibility, columns, visualizer, etc.
Slide 35: This slide highlights title for topics that are to be covered next in the template.
Slide 36: This slide presents difference between data science and data analytics based on skillset, scope, exploration and goals.
Slide 37: This slide shows difference between Business Intelligence and Data Science based on the factors such as concept, scope, data, etc.
Slide 38: This slide highlights title for topics that are to be covered next in the template.
Slide 39: This slide represents tasks performed by the business analyst and how he will be helpful to improve business operations.
Slide 40: This slide shows data engineers’ responsibilities and skills that they should possess.
Slide 41: This slide presents tasks performed by a Database Administrator and skills that he should possess.
Slide 42: This slide shows machine learning engineer’s tasks and skills, including a deep knowledge of machine learning, ML algorithms, and Python and C++.
Slide 43: This slide displays the tasks performed by data scientists in data science and their skills.
Slide 44: This slide represents the different types of data scientists, including vertical experts, stat DS managers, generalists, etc.
Slide 45: This slide shows data architect’s tasks in data science projects and their skills.
Slide 46: This slide presents tasks performed by a statistician in data science and his skills such as data mining, distributive computing, etc.
Slide 47: This slide shows tasks performed by the business analyst and how he will be helpful to improve business operations.
Slide 48: This slide displays tasks performed by a data and analytics manager and skills he should have.
Slide 49: This slide represents RACI matrix for data Mining and tasks performed by data analysts, data engineers, data scientists, etc.
Slide 50: This slide highlights title for topics that are to be covered next in the template.
Slide 51: This slide presents Checklist for Effective Data Science Integration in Business.
Slide 52: This slide highlights title for topics that are to be covered next in the template.
Slide 53: This slide displays Table of Content highlighting Timeline for Data Mining Implementation in the Organization.
Slide 54: This slide represents Table of Content highlighting Roadmap to Integrate Data Mining in the Organization.
Slide 55: This slide shows Roadmap to Integrate Data Mining in the Organization.
Slide 56: This slide highlights title for topics that are to be covered next in the template.
Slide 57: This slide shows 30-60-90 Days Plan for Data Mining Implementation.
Slide 58: This slide displays Dashboard for Data Mining Implementation.
Slide 59: This slide represents dashboard for data integration in the business, and it is showing real-time details about expenses, profits, margins percentage, etc.
Slide 60: This slide highlights title for topics that are to be covered next in the template.
Slide 61: This slide presents Impacts of Data Mining Integration in the Organization.
Slide 62: This slide highlights title for topics that are to be covered next in the template.
Slide 63: This slide displays Domains where Data Mining is Creating its Impression.
Slide 64: This slide represents data Mining in healthcare departments and its benefits in different ways.
Slide 65: This slide shows Data Mining in Logistics and Transportation Department.
Slide 66: This slide presents data Mining role in airlines and its benefits that cover revenue management and route planning.
Slide 67: This slide shows application of data Mining in financial organizations and its benefits.
Slide 68: This slide displays the data Mining application in business and its benefits.
Slide 69: This slide highlights title for topics that are to be covered next in the template.
Slide 70: This slide shows the meaning of data Mining and how this innovation is helpful in businesses developing AI systems.
Slide 71: This slide presents critical components of data Mining such as data, programming, statistics & probability, etc.
Slide 72: This slide displays Icons for Data Mining.
Slide 73: This slide is titled as Additional Slides for moving forward.
Slide 74: This is Our Mission slide with related imagery and text.
Slide 75: This slide presents Bar chart with two products comparison.
Slide 76: This slide showcases Magnifying Glass to highlight information, specifications etc
Slide 77: This is a Timeline slide. Show data related to time intervals here.
Slide 78: This slide shows Post It Notes. Post your important notes here.
Slide 79: This is an Idea Generation slide to state a new idea or highlight information, specifications etc.
Slide 80: This slide presents Roadmap with additional textboxes.
Slide 81: This slide provides 30 60 90 Days Plan with text boxes.
Slide 82: This is a Thank You slide with address, contact numbers and email address.
Data Mining Powerpoint Presentation Slides with all 87 slides:
Use our Data Mining Powerpoint Presentation Slides to effectively help you save your valuable time. They are readymade to fit into any presentation structure.
-
Data Mining
-

Agenda for Data Mining
-
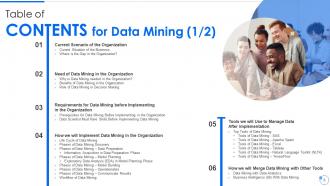
Table of Contents for Data Mining 1 2
-

Table of Contents for Data Mining 2 2
-

Table of Contents for Data Mining
-

Current Situation of the Business
-

Where is the Gap in the Organization
-

Table of Contents for Data Mining
-

Why is Data Mining needed in the Organization
-

Benefits of Data Mining to the Organization
-
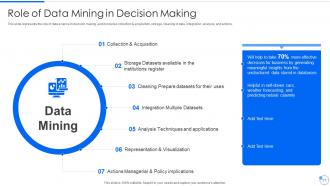
Role of Data Mining in Decision Making
-

Table of Contents for Data Mining
-

Prerequisites for Data Mining Before Implementing in the Organization
-

Data Scientist Must Have Skills Before Implementing Data Mining 1 2
-
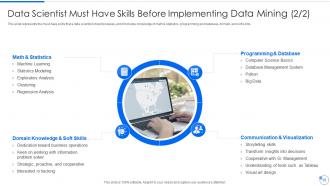
Data Scientist Must Have Skills Before Implementing Data Mining 2 2
-

Table of Contents for Data Mining
-
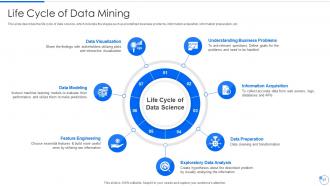
Life Cycle of Data Mining
-
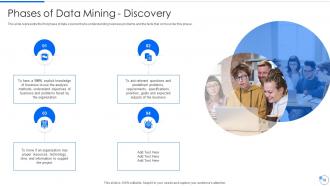
Phases of Data Mining Discovery
-

Phases of Data Mining Data Preparation
-

Information Acquisition in Data Preparation Phase
-
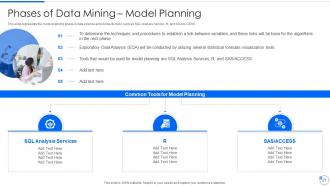
Phases of Data Mining Model Planning
-
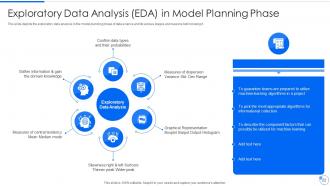
Exploratory Data Analysis EDA in Model Planning Phase
-

Phases of Data Mining Model Building
-
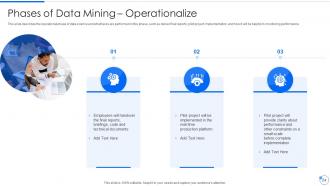
Phases of Data Mining Operationalize
-

Phases of Data Mining Communicate Results
-
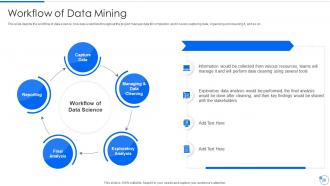
Workflow of Data Mining
-

Table of Contents for Data Mining
-

Top Tools of Data Mining
-

Tools for Data Science SAS
-

Tools for Data Mining Apache Spark
-

Tools for Data Mining Excel
-

Tools for Data Mining Tableau
-

Tools for Data Mining Natural Language Toolkit NLTK
-

Tools for Data Mining TensorFlow
-

Table of Contents for Data Mining
-

Data Mining with Data Analytics
-
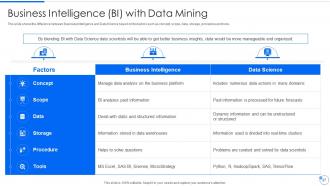
Business Intelligence BI with Data Mining
-

Table of Contents for Data Mining
-

Tasks and Skills of Data Analyst
-

Tasks and Skills of Data Engineers
-

Tasks and Skills of Database Administrator
-

Tasks and Skills of Machine Learning Engineer
-

Tasks and Skills of Data Scientist
-

Different Types of Data Scientists
-

Tasks and Skills of Data Architect
-

Tasks and Skills of Statistician
-

Tasks and Skills of Business Analyst
-
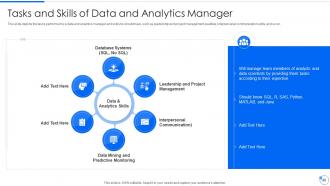
Tasks and Skills of Data and Analytics Manager
-

RACI Matrix for Data Mining
-

Table of Contents for Data Mining
-

Checklist for Effective Data Mining Integration in Business
-

Table of Contents for Data Mining
-
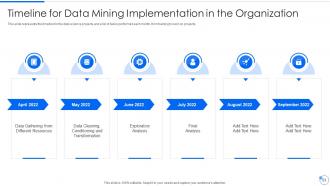
Timeline for Data Mining Implementation in the Organization
-

Table of Contents for Data Mining
-

Roadmap to Integrate Data Mining in the Organization
-

Table of Contents for Data Mining
-
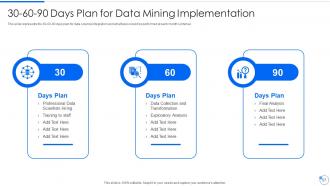
30 60 90 Days Plan for Data Mining Implementation
-
Table of Contents for Data Mining
-

Dashboard for Data Mining Implementation
-

Table of Contents for Data Mining
-

Impacts of Data Mining Integration in the Organization
-

Table of Contents for Data Mining
-

Domains where Data Mining is Creating its Impression
-

Data Mining in Healthcare Department
-
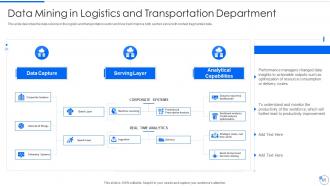
Data Mining in Logistics and Transportation Department
-
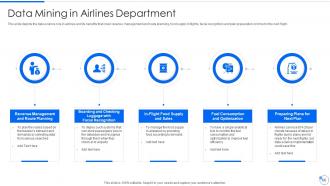
Data Mining in Airlines Department
-

Data Mining in Finance Sector
-

Data Mining in Business Sector
-

Table of Contents for Data Mining
-

What is Data Mining
-

Critical Components of Data Mining
-

Icons Slide for Data Mining
-

Additional Slides
-

Our Vision Mission and Goal
-

Bar Chart Template
-

Magnifying Glass
-

Timeline
-

Post it Notes
-

Idea Generation
-

Roadmap
-

30 60 90 Days Plan
-

Thanks for Watching
-

-

-

-

-

FAQs for Data Mining
So there's basically four main approaches you'll run into. Classification predicts categories - like is this email spam or not? Regression handles numbers, like predicting house prices. Those two need training data where you already know the answers. Then there's clustering, which just groups similar stuff together without you telling it what to look for. Association rules find those "customers who bought this also bought that" patterns. I know the names sound super academic, but once you mess around with them a bit, they start making way more sense. What you pick really depends on whether you're trying to predict something specific or just poking around to see what patterns exist in your data.
Honestly, data mining in healthcare is pretty cool - you can predict patient outcomes and spot who's gonna have complications before they actually happen. Medical records, lab work, imaging data... all that stuff has patterns if you know how to look. Machine learning picks up on things doctors might miss, especially for catching high-risk patients early. Hospital readmissions, medication stuff, even disease outbreaks can be predicted. Just make sure your data's clean (messy EHR data is the worst) and you're not violating privacy rules. I'd start with something specific like diabetic complications first. Once that works, then you can get fancy with bigger predictions.
Honestly, big data is a game changer for data mining. You're working with millions of data points instead of just thousands, which means your algorithms can actually spot patterns that would be completely invisible otherwise. The accuracy gets way better too. Plus you've got all these different data types - text, images, sensor stuff - so the insights end up being much richer. Yeah, the storage and processing can be a pain (learned that the hard way), but the pattern recognition improvement is totally worth it. My advice? Start with just a chunk of your data first to test things out, then scale up once you know what works.
Look, ethics will definitely slow down your data collection process, but that's honestly a good thing. Privacy and consent are huge - just because someone's info is public doesn't mean they want it mined, you know? Plus you've got to worry about bias creeping into your algorithms. Anonymizing data helps, being transparent about your methods too. The discrimination angle is tricky though, especially with protected groups. My advice? Bake these considerations in from the start. Way easier than dealing with backlash later when something goes sideways.
Honestly, data cleaning is going to be your worst enemy - missing values, weird inconsistencies, just absolute chaos that eats up your time. Then you're either drowning in too much data or don't have enough to spot real patterns. Feature selection is such a pain because who knows which variables actually matter? Overfitting happens way more than you'd think too. And good luck explaining your model to non-tech people when it works but you can't say why. My biggest tip? Seriously spend like 3x longer on data prep than you planned. I learned this the hard way and it'll save you so much trouble later.
Data mining is seriously a game changer for understanding customers. You can dig into their buying patterns and spot who's about to bail on you before it happens. The cool part? It finds stuff you'd never catch manually - like which customers always buy certain products together. Honestly, most companies are sitting on tons of useful data they're not even using. You can create customer groups, predict what they'll want next, then actually personalize your marketing instead of blasting everyone with the same generic stuff. Start with whatever data you've got and pick one specific question you want answered.
Python's probably your best bet to start - scikit-learn and pandas are solid, plus the community is huge so you won't get stuck. R's really good too if you're more into the stats side of things. SQL you'll need regardless for pulling data. Academic folks love Weka (I totally spaced on that one for a while). Enterprise world runs on SAS, SPSS, Tableau for dashboards. Honestly just pick based on what your team's already using or what feels less painful to learn. Python's more flexible though, so that's usually my go-to recommendation.
Honestly, data preprocessing is what separates successful projects from total disasters. Skip cleaning your messy data and you're basically feeding garbage to your algorithms. Missing values, weird outliers, different scales - all that stuff will mess up your results big time. I learned this the hard way on a project last year, ugh. Feature selection and variable transformation? They directly affect whether you'll actually find meaningful patterns. Yeah, you'll probably spend like 70% of your time just cleaning data, but trust me - that's where you actually win or lose.
Once you notice it, data mining is literally everywhere. Amazon's recommendations? That's them digging through your purchase history. Netflix does the same with movie suggestions. Your credit card company flags weird purchases in real-time to catch fraud - pretty neat actually. Even grocery stores mine your loyalty card data for those random coupons you get. Google's search results are basically just really fancy data mining too. For your own business, honestly just start simple. Look at basic customer purchase patterns first. You'd be shocked what trends pop up, even from basic stuff like that.
Dude, seriously - clean your data first or you'll hate yourself later. Remove duplicates, fix wonky formatting, deal with missing stuff properly. I know it's tedious but I've watched so many projects crash and burn because people thought they could skip it. Set up some automated checks too so you catch problems early. Oh and write down what you did! Otherwise six months from now you'll be staring at your own work like "what was I thinking?" The boring prep work saves you from making terrible decisions based on garbage data.
So for imbalanced datasets, I'd probably start with adjusting class weights - it's super easy and works surprisingly well. SMOTE is really popular for oversampling the minority class, though sometimes it generates kinda funky synthetic examples that don't make total sense. You could also just undersample the majority class if you've got tons of data. Random Forest handles this stuff pretty naturally without much tweaking. Oh, and cost-sensitive learning is worth trying too - basically you're telling the model "hey, don't screw up the minority class." Honestly, just try class weights first and see what happens.
So machine learning is what runs most data mining these days. You've got algorithms like regression, clustering, neural networks - they automatically find patterns in your data without you coding every single rule. Honestly, the old statistical methods are pretty much dead at this point. Feed your dataset in and the algorithms learn to spot trends or make predictions on their own. Oh, and if you're serious about this stuff, definitely pick up Python and scikit-learn. Trust me, you'll need them. The two fields have basically merged anyway.
First thing - test your results against known data or benchmarks. Can't trust patterns that fall apart under basic scrutiny. Make sure you actually understand what the algorithms found, not just that they found something cool-looking. I've watched people get way too hyped about correlations that make zero business sense, honestly. Look for sampling bias or seasonal weirdness that might mess with your interpretation. Get domain experts involved early - they'll catch meaningful stuff vs. statistical garbage faster than you ever will. Oh, and document your assumptions upfront so everyone knows what they're dealing with.
Honestly, visualization is a game-changer for data mining stuff. Your brain just can't make sense of endless spreadsheet rows - but throw that same data into a scatter plot or heat map? Boom, patterns pop out instantly. I love how decision trees make classification rules super obvious. Short version: charts and graphs turn confusing numbers into actual insights. Oh, and when you're presenting to non-data people (which is always), visuals save your life. They'll actually get what you're saying. Start simple with basic plots, then get fancy later if you need to.
Honestly, AutoML is the biggest game-changer right now - it's making data mining way easier for people who aren't total experts. Real-time processing is becoming standard instead of that old batch stuff. Edge computing's pretty cool too, like running models directly on IoT devices rather than cloud-first everything. Privacy stuff like federated learning is getting huge attention (all those regulations, you know?). Graph analytics and explainable AI are super hot topics. Oh, and definitely start playing around with AutoML tools now. They're gonna completely change how your team tackles data projects - trust me on this one.
-
Thanks for all your great templates they have saved me lots of time and accelerate my presentations. Great product, keep them up!
-
Great product with highly impressive and engaging designs.