Do you know that statistics are pivotal in shaping decision-making across industries? Statistics can condense and present the collected data for easy understanding.
Why Do You Need a Statistical Report?
Crafting statistical reports is essential, especially when compiling data for presentations, sharing results with colleagues, presenting data at conferences, monitoring progress over time or analyzing information in business contexts.
Using statistics helps researchers and professionals check the data for correctness and make intelligent choices. These statistics can show details or make guesses about the data, giving helpful information about quality, correct fit and applications of the data in decision making.
Craft compelling research proposals with our comprehensive Statistical Analysis Research Proposal Templates.
You might be wondering how to create a statistical report template from scratch, which demands expertise in statistics, design, and customization.
Slide Team offers 100% editable and customizable templates, saving time and ensuring quality. Efficiently map out the strategies and methods your company plans to implement using this content-ready statistical report template.
Let's Explore!
Template 1: - Statistical Analysis of Research Findings Proposal Example Report
Are you searching for a comprehensive statistical analysis research proposal that serves as a roadmap for acquiring insights from data? This content-ready PowerPoint Presentation, consisting 37 slides, covers topics such as the cover letter, project context and objectives, scope of work, and plan of action. It also includes key deliverables, timelines, cost structure, and a detailed company overview highlighting services offered, team details, areas served, and client testimonials. The proposal elaborates on case studies, statements of work, next steps, and contact details, demonstrating the ability to deliver high-quality, tailored business proposals. This slide empowers professionals and businesses to take on their projects and endeavors with clear resolve and knowledge.
Template 2: - Plan of Action for Statistical Analysis of Research Findings
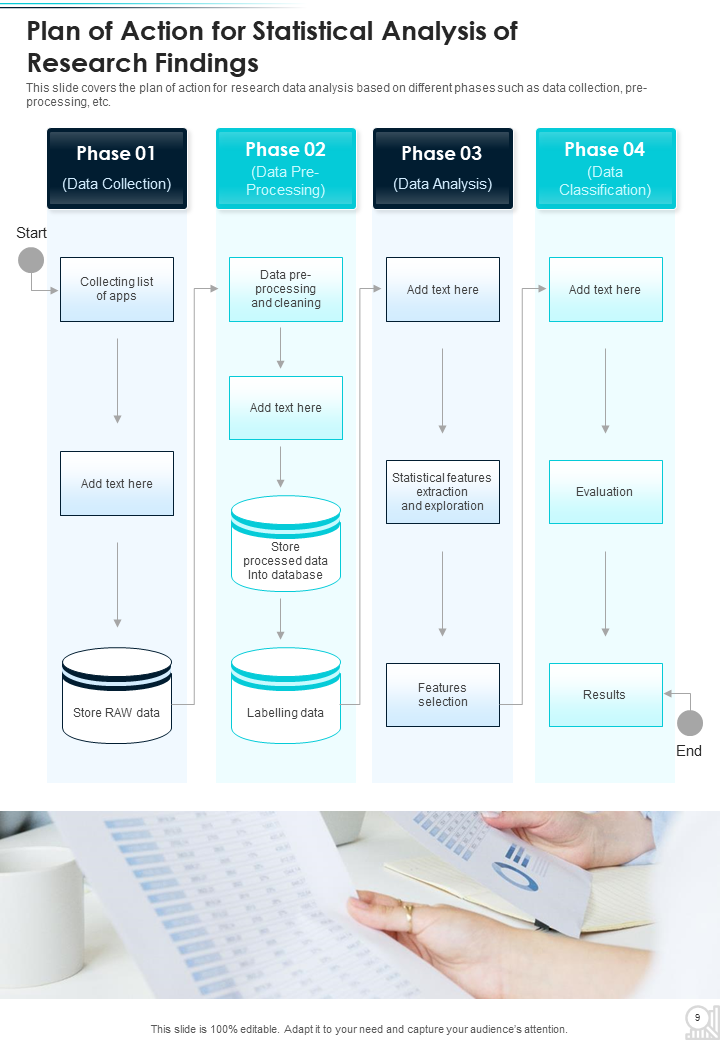
Deploy this actionable PowerPoint Template that outlines the steps necessary to achieve project goals and objectives. This presentation template covers data analysis, including data collection, pre-processing, analysis, and classification. The detailed phases provided in this presentation guide you in defining goals, collecting data, and conducting analysis. Deploying this template enables you to communicate this information effectively to decision-makers within your organization, empowering them to drive business strategies. Grab it Now!
Template 3: - Timeline for Statistical Analysis of Research Findings
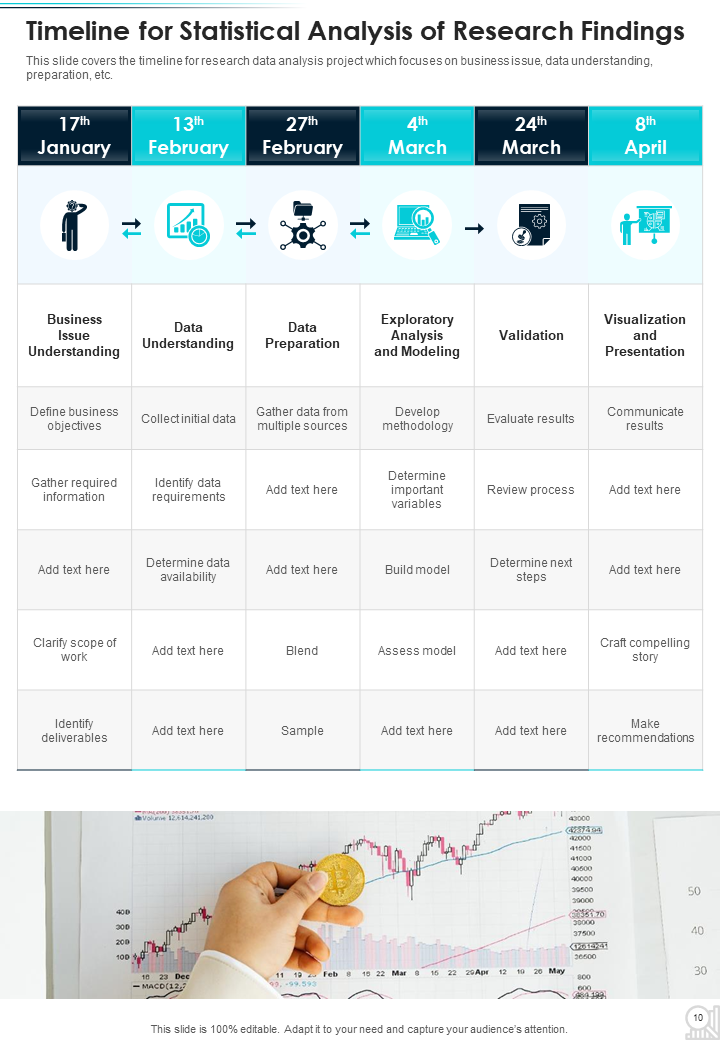
This PPT Template highlights Timeline analysis, a crucial component for research findings, enabling the viewing and interpretation of data by sorting it based on criteria like chronological dates or specific event types. This slide aids research data analysis projects focusing on business issues, data understanding, and preparation, showcasing the company's proficiency in managing various research data analysis stages. It also assists in project planning and resource allocation by dividing the process into clear phases and presenting a coherent and logical project flow, from issue identification to actionable insights.
Template 4: - Why our Statistical Analysis Company
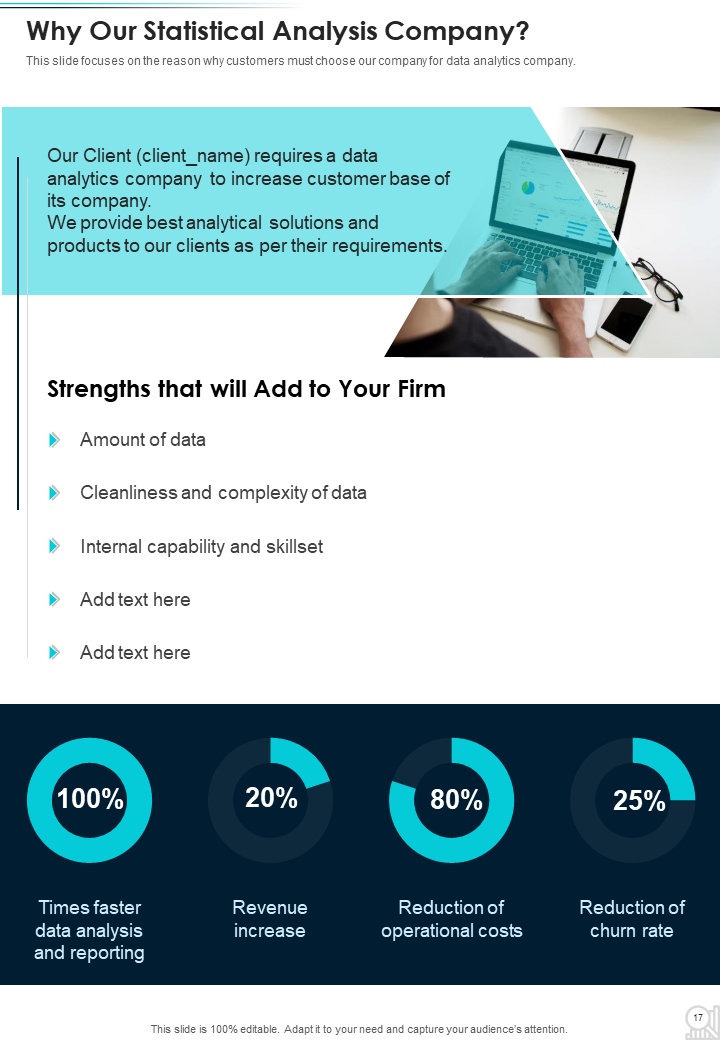
Enhance your business with data analytics solutions that fuel growth and maintain your competitive edge. This PPT Template showcases the company's strengths, including data volume, data quality, complexity, internal capabilities, and skill sets, capturing the interest of potential clients. Through this presentation, clients gain insight into the strategic benefits of selecting the showcased company for data analytics needs. Additionally, it provides an overview of the company's unique selling points in data analytics, such as accelerated data analysis, revenue growth, cost reduction, and decreased churn rates. Download now to leverage these advantages!
Template 5: - Services Offered by Statistical Analysis of Research Findings
This PowerPoint presentation showcases the services provided by Data Analytics Services, enabling businesses to collect, process, and present actionable insights from their data without investing in developing and administering an analytics solution. These services encompass Enterprise Analytics Solutions, Social Media & Digital Outreach, Data Collection Services, Policy Analytics & Decision Support, Data Integration & Visualization, and Data Quality Assessment & Improvement. Elevate your data strategy today with analytics solutions tailored to your business needs.
Template 6: - Complete Statistical HR Annual Report of Employees
Use this PowerPoint Template to analyze the outcomes of the previous year's people strategy and plan for the next one, reviewing crucial aspects such as hiring actions, departing employees, promotions, transfers, demotions, and more over the past four years. This presentation empowers the human resources department to effectively process data, draw insights, and develop action plans to enhance or sustain results in the coming year.
Template 7: - ABC Company Sales Trends Analysis Statistical Report
This PowerPoint Template facilitates businesses in conducting sales trend analyses, enabling them to determine whether sales are increasing or decreasing over previous periods. It encompasses current-year sales, gross profit, new customers, monthly sales trend graphs, pie charts for quotes and estimates, and top-5 sales by region and customer for any company. By presenting data over time from multiple sources and comparing it with previous periods, this template aids in identifying patterns and forecasting trends. Grab it Now!
Template 8: - HR Services Statistical Summary Presentation Report Infographic
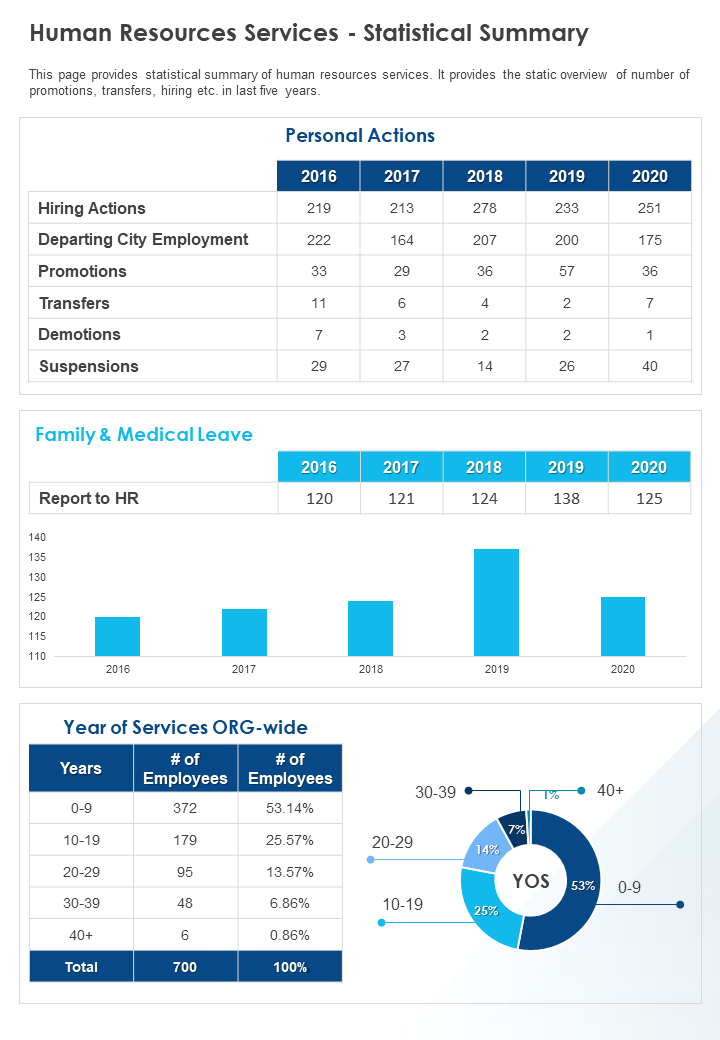
Have you wondered what good HR services can do? They boost employee engagement and productivity, ensure legal compliance, and create a positive work environment. This PowerPoint Presentation offers a statistical overview of HR services, encompassing personnel department actions like Hiring, Departures, Promotions, Transfers, Demotions, and Suspensions over the past five years and data on Family & Medical Leave. It also illustrates the Year of Service organization-wide, with figures and percentages depicted through a pie chart. The services outlined in this PowerPoint Template cater to a broad spectrum of business requirements, accommodating startups and multinational corporations.
Template 9: - Staff Productivity and Turnover Rate Statistical Report
Understanding the root causes of turnover is crucial for successful recruitment and employee retention strategies. This PowerPoint Presentation encompasses a dashboard displaying employee productivity statistics and data on absence rates, incurred costs, derived benefits, satisfaction index, net promoter score, turnover, and promotion rates. Employers must retain top talent given the continuously evolving labor market. Get this PPT Template now!
Template 10: - Quarterly Customer Complaint Statistical Report
Failure to deliver a positive customer experience has consequences. A statistical report on customer complaints can pinpoint issues concerning your product, employees, or internal processes, allowing you to address them directly, investigate, and implement improvements to mitigate future complaints. This PowerPoint Presentation showcases a quarterly analysis of customer complaints aimed at enhancing processes and fostering customer loyalty. It provides insights into customer grievances and firm and industry percentages. Positive experiences with your company prompt customers to share their experiences with others, potentially generating new business opportunities through word-of-mouth referrals. Get the slide now!
Accelerate your market research endeavors with our versatile Market Analysis Report Templates.
Efficient Data Analysis Non-negotiable
Unlock the power of data visualization with our dynamic statistical report template, designed to quickly transform complex information into actionable insights. Its versatile features facilitate efficient data analysis and presentation, empowering organizations to make informed decisions and communicate findings effectively. Deploying this Template can significantly enhance the impact and effectiveness of statistical reports, driving actionable insights and strategic initiatives.
PS: - Empower your data-driven decision-making with our dynamic Analytics Report Templates.


 Customer Reviews


