Take a look at the competitive business landscape around you.
If your organization aims to thrive and profit amidst this, then planning and analysis are a necessity. Without planning you'll lead a fruitless pursuit; without analytics, your venture will be misguided, mediocre, and missing out on many business opportunities to excel.
In this blog, we will help you refine your endeavors with our editable and content-ready analytics report templates.
Why Do You Need to Create Analytics Reports?
Analytics reports help impart a deeper understanding of where an individual or organization is headed. With the help of tools or manually, data is first extracted and processed into information, from which facts and figures are then communicated. The ultimate aim is better decision making.
Whether it is website analytics, marketing analytics, overall business analytics, or even personal analytics, professionals must dedicate time and resources to generate meaningful insights. This is the reason why well-analyzed data is considered an asset for any organization.
On the other hand, a disorganized analytics report will render all data collection efforts futile, and the end product becomes of no value. Instead, why not put dedicated efforts in the first place to create well-organized analytics reports. These will act as a reliable source of information whenever needed.
As a solution, we present our most-downloaded and in-use analytics report templates to help organize your insights on business and individual efforts at improvement. Prepare assets of information that are of business value for the present and future. With these 100% editable and intelligently designed analytics report templates, plan your success.
Template 1: Web Analytics Report Template
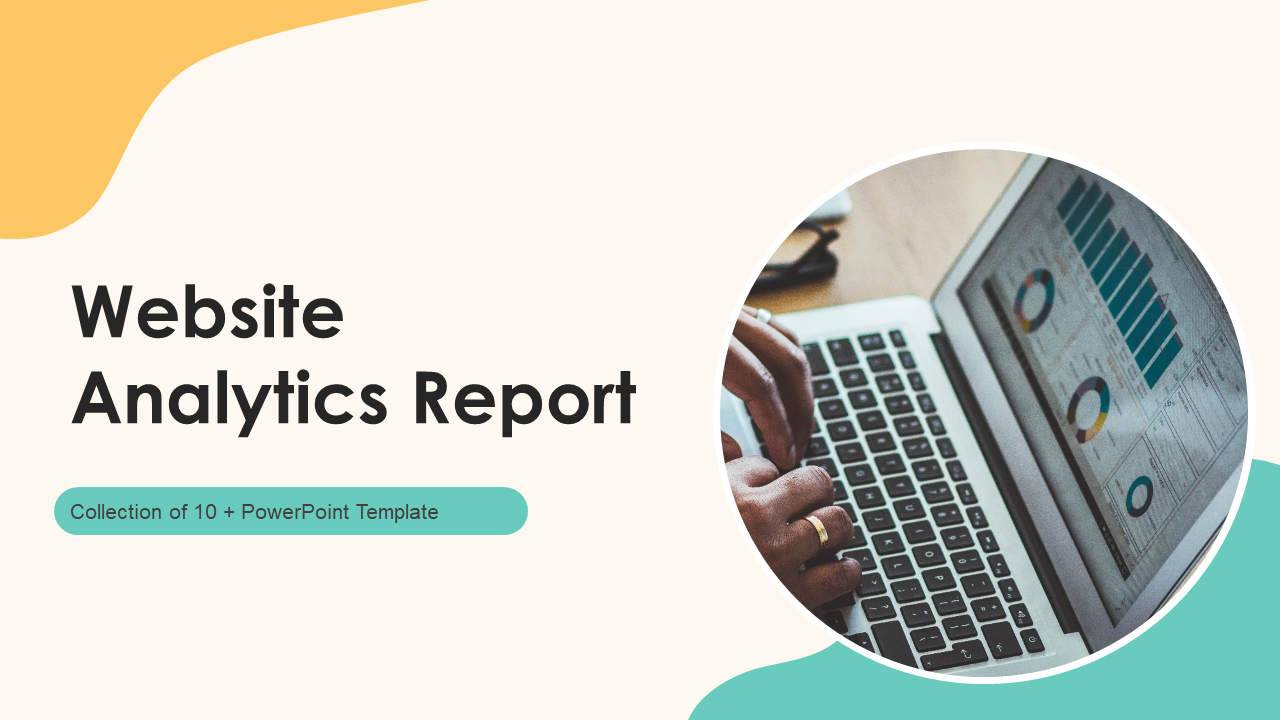
Here is a comprehensive web analytics report template to present your website statistics. Monitor website sessions and usage over months. Track traffic sources, conversion rates, and visit trends to prepare an all-encompassing progress report of your website performance. Enriched with graphs, sheets, and charts, this PPT Presentation is ideal for sharing web analytics reports. Download now.
Template 2: Marketing Analytics Document Report Template
Present a detailed snapshot of your marketing analytics with this document report template to present before stakeholders and top management. Share details of consolidated financial data and identify your position in the marketing pyramid. Use this characteristic report template to guide your audience on your sales and marketing platforms. Specify how you have grown your customer base in diversity and successful marketing campaigns. Grab this PPT Design to entice your audience today!
Template 3: Email Analytics Reporting Template
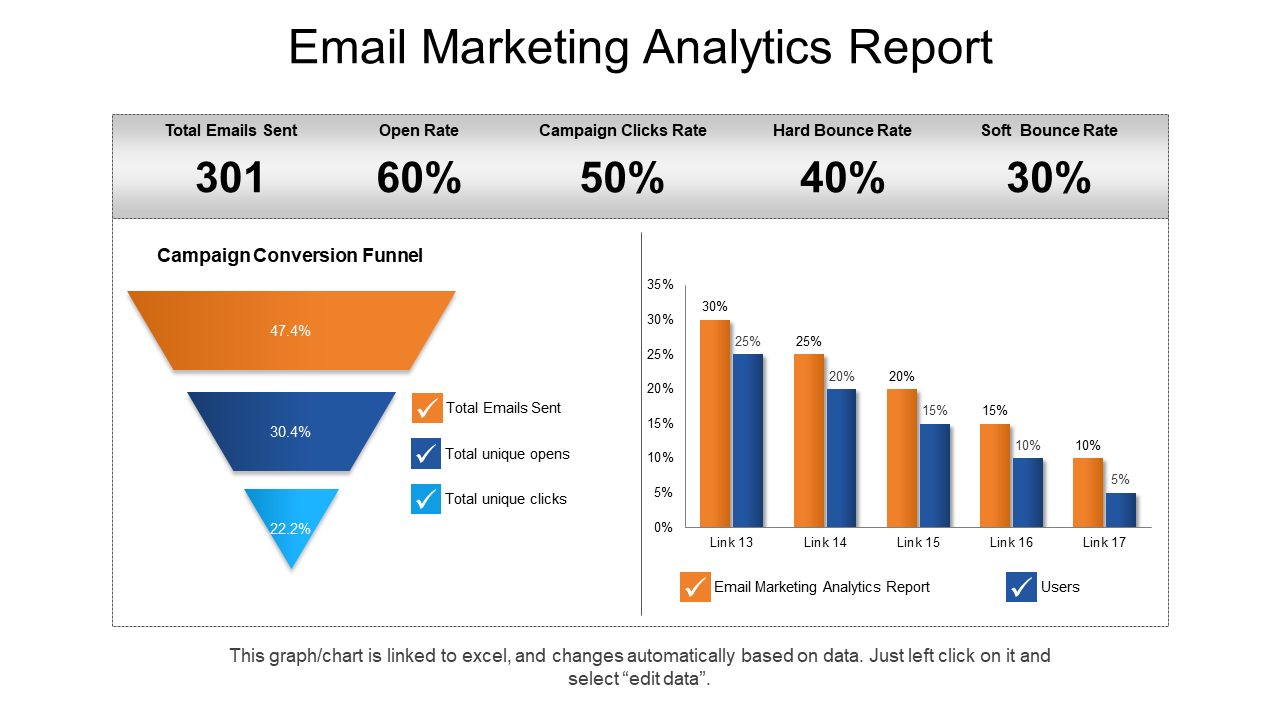
Are you invested in trendy email marketing campaigns? Then present your analysis of the last campaign with this PPT layout. For the multiple emails sent, track their open rates, click rates, and bounce rates. Categorize bounce rate numbers into hard and soft bounces. Using this PPT Slide, you can even point out your conversion funnel, and present individual data for all links sent to your recipients. Grab it now!
Template 4: Mobile Analytics Report Template
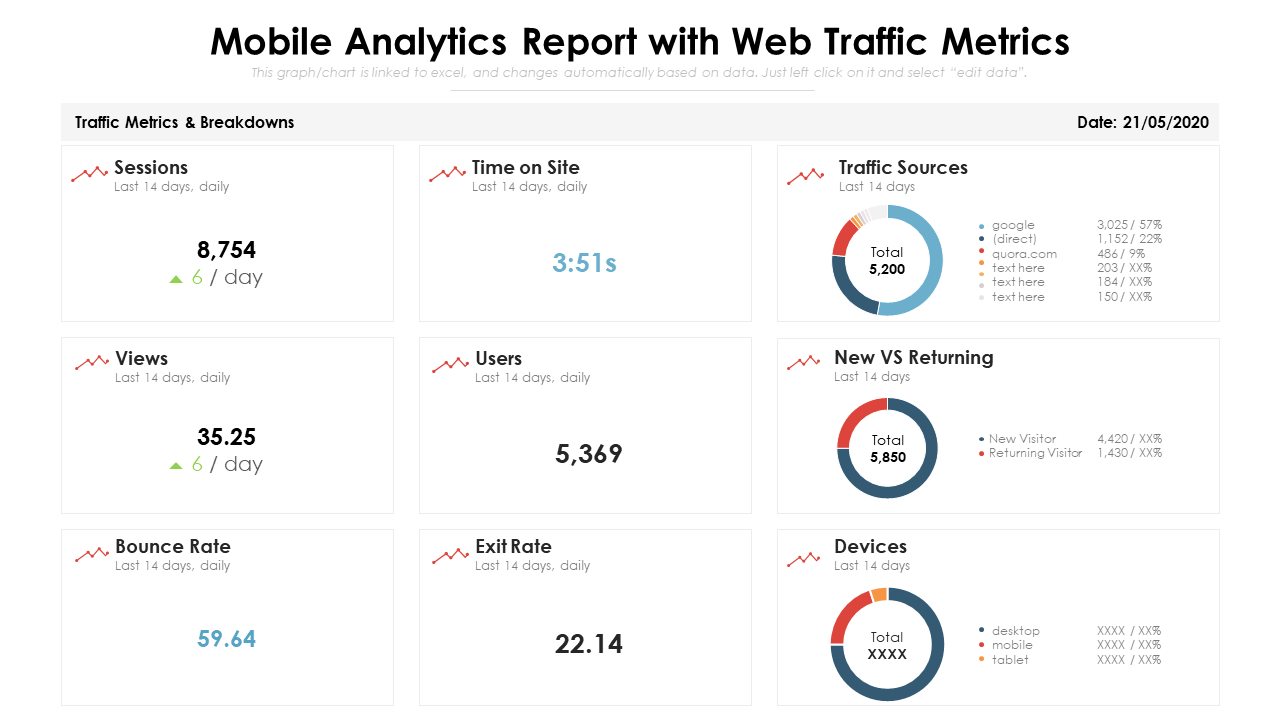
If your web app is mobile friendly, track its analytics via this editable PPT layout. Monitor web traffic, time spent on site, views, etc from your mobile users. Simultaneously, monitor the inflow and outflow rates of users via metrics like bounce rates, exit rates, new Vs returning viewers etc to create an evaluation of website performance. Grab this content-ready utility now!
Template 5: One-Page SEO Analytics Report Template
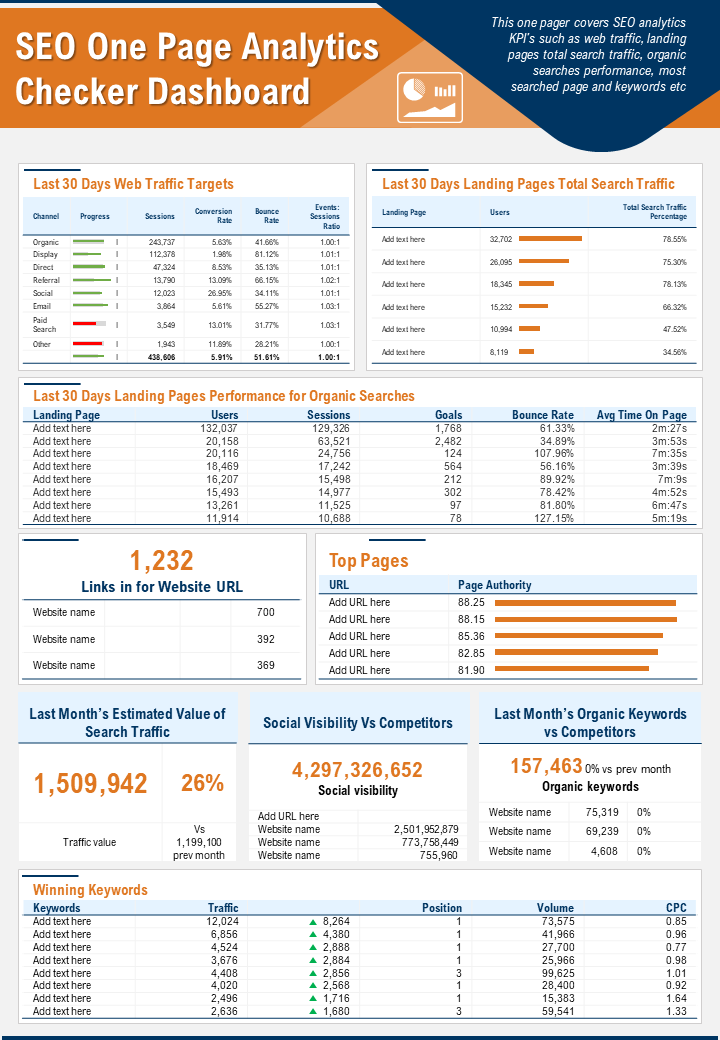
Maintain a record of your SEO analytics with this one-page PPT Template. Keep an eye on metrics like organic searches, web traffic, along with an insight into bounce rates, users, etc. Mention the number of active links of websites and the number of times these were clicked. Keep an eye on social visibility vs competitors, top pages and thereby identify the top winning keywords, all in this editable PPT Template. Grab it now.
Template 6: Complete Digital Analytics Report Template
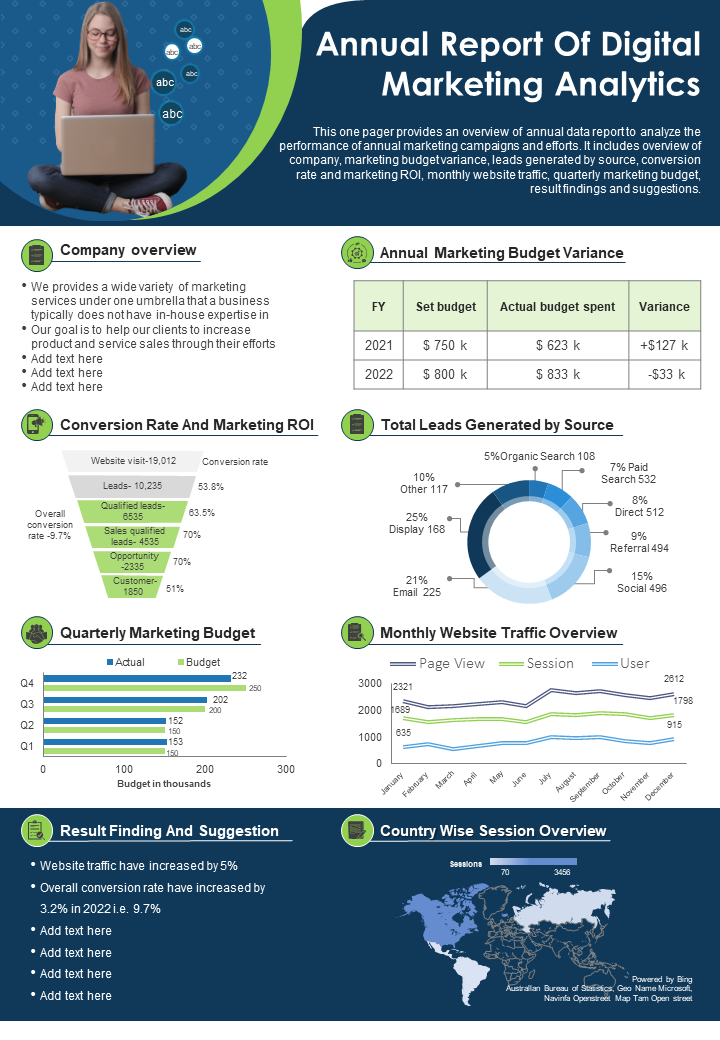
Create a comprehensive one-pager analytics of your digital marketing performance with this PPT Template. Fill the primary parameters of a general digital marketing analytics report by firstly providing your business insights, with the annual marketing budget variance next. Also, present conversation rates, leads generated, and overall traffic overview. Using these stats as reference, deduce key results for future digital marketing campaigns. Enriched with Excel-linked graphs, sheets, and charts, this complete digital analytics report template is ideal for keeping check of your marketing endeavors. Download it now.
Template 7: Annual Marketing Analytics Report Template
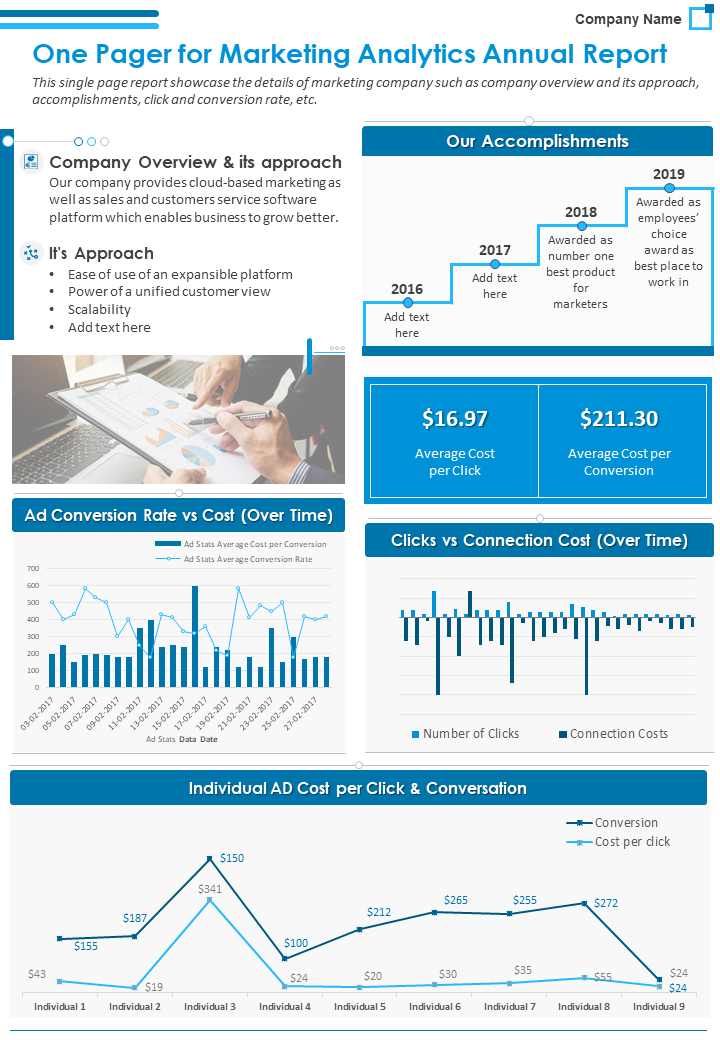
Looking for a dedicated annual marketing analytics report template? Then explore no further than this one-page editable template. Start with your company overview, followed by its objective and accomplishments. Then, assess your marketing channels to provide insights into annual traffic, conversions, and visits. Use a range of graphs to visualize how you can improve KPIs. Compare cost over results yielded in terms of clicks generated, and conversions made. Get this editable PPT Layout now!
Template 8: Accident Analytics Report Template
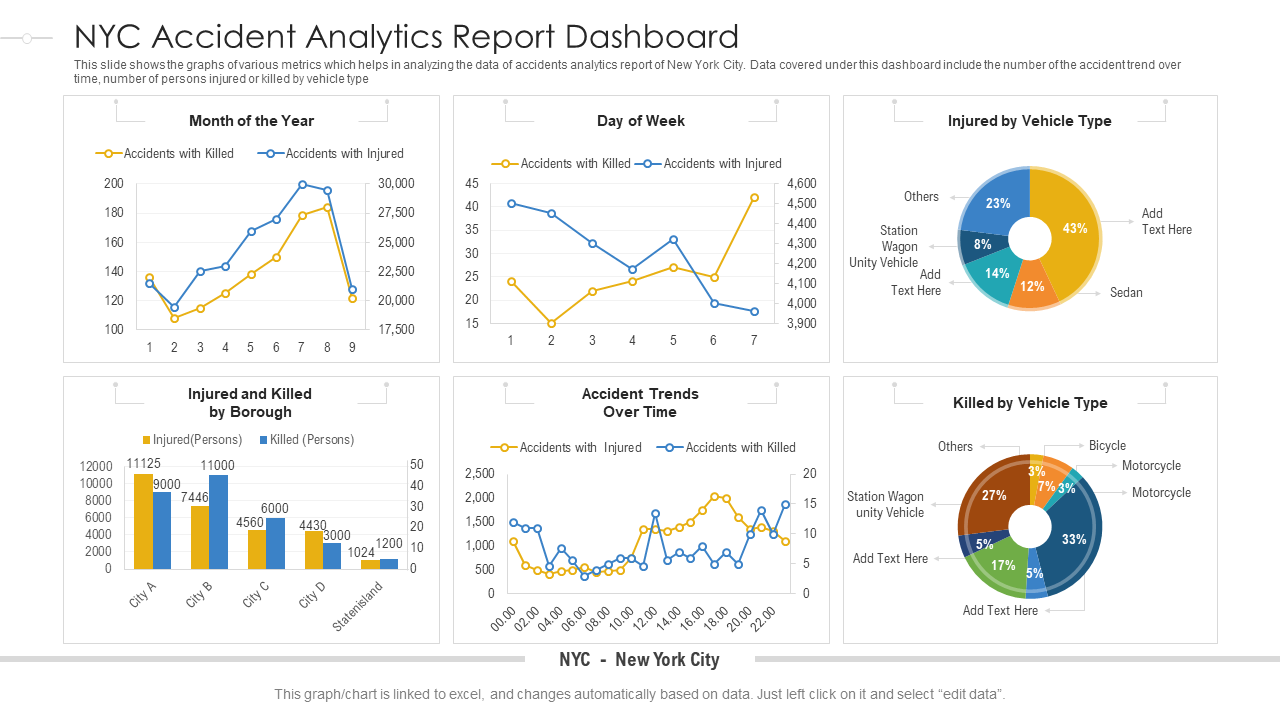
If you are working toward ensuring road safety and security in the city, then use this accident analytics report template to maintain checks on how well you have fared. Track the frequency of monthly and weekly accidents via this graphical PPT slide. Categorize accidents by the vehicle type and rate of deaths, and injuries by their vehicle type. Check how secure your campaigns and awareness programs are rendering the city. This analytics report slide can also be used to spread general awareness on accidents and thereby prevent it. Grab it from the link below.
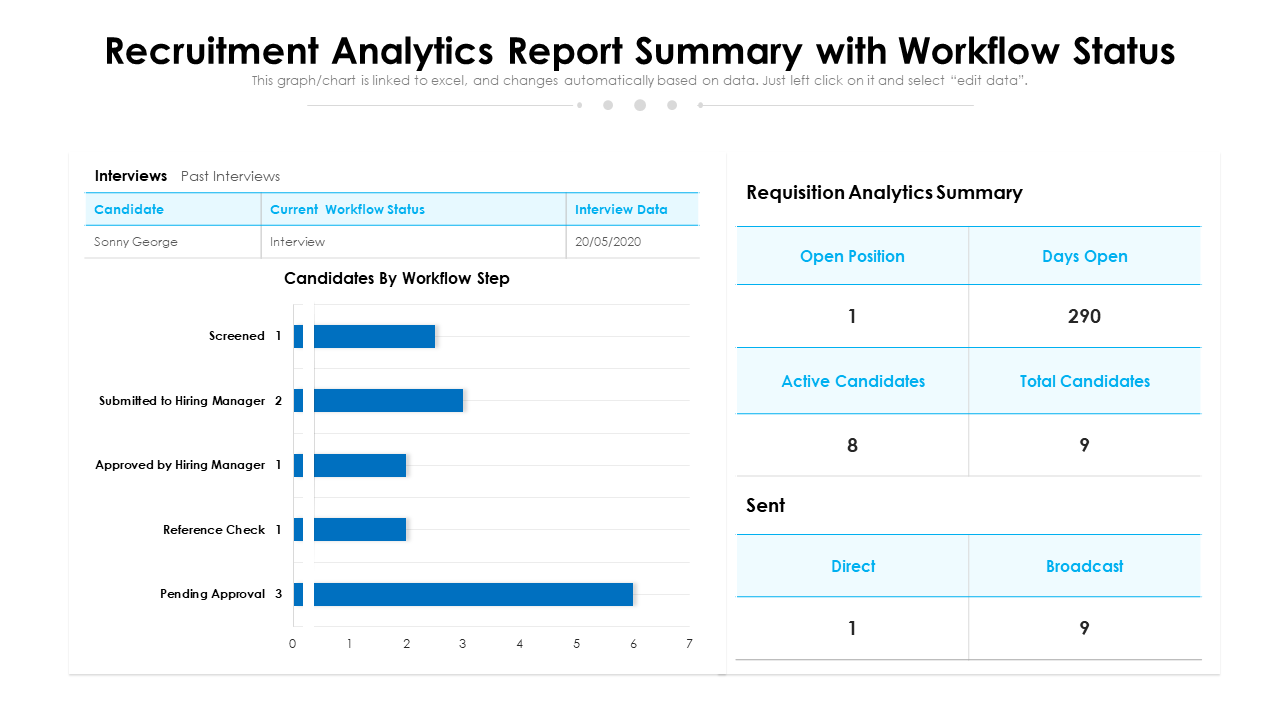
Template 9: Recruitment Analytics Report Template
The HR department can also use analytics to keep track of recruitment and workflow statuses. State the hiring statistics in terms of numbers and compare these over years, months, or recruitment sessions held. With this analytics template, you can also monitor open positions and the stages at which candidates are in the process of recruitment. Without any ado, grab this content-ready template now.
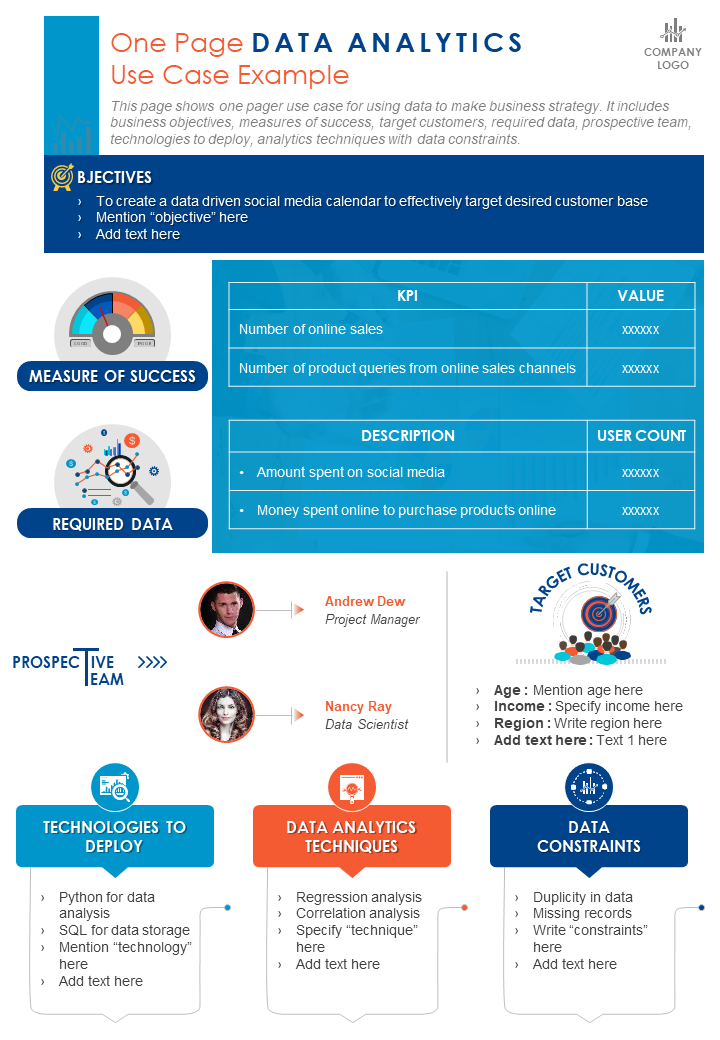
Template 10: One-Page Data Analytics Report Use Case Example
Lastly, here's a use case example with special attention to the primary parameters involved in a data analytics survey to enhance your business strategy. Specify the objectives and the data employed to generate this analytics. Mention the project manager and data scientist, with a photograph, leading the analysis. Additionally, specify the technologies, techniques, and data constraints employed while generating this analytical report. Grab it now.
Claim these content-ready templates to present meaningful business insights. Choose from this diverse analytics report template collection now!
PS: Are you suspicious about uncontrollable variables disrupting your seamless office operations? It's time to have an inspection plan in place for which we have chosen the ideal blog to help you frame one for your organization.
FAQs on Analytics Report Template
What is an analytics report?
An analytics report is a document or presentation that summarizes and presents data in a meaningful and actionable way. It can include information such as metrics, graphs, and charts that help analyze and understand patterns and trends in the data. Analytics reports are often used in business, marketing, and other fields to track performance, identify opportunities for improvement, and make informed decisions.
How to create an analytics report?
Creating an analytics report typically involves the following steps:
- Define the purpose of the report: Identify the main goals and objectives of the report and the key questions it should answer.
- Collect data: Gather the relevant data from different sources, such as databases, spreadsheets, and tracking tools.
- Clean and organize the data: Prepare the data for analysis by removing any errors, inconsistencies, or irrelevant information.
- Analyze the data: Use statistical techniques, such as descriptive statistics, correlation, and regression, to identify patterns and trends in the data.
- Visualize the data: Create charts, graphs, and other visualizations to help present the data in a clear and concise manner.
- Write the report: Use the data and visualizations to write a report that explains the findings, highlights key insights, and provides recommendations.
- Review and distribute the report: Review the report to ensure accuracy and clarity and then distribute it to the relevant stakeholders.
It's important to note that reports have different requirements, and that the above steps may vary depending on the specific report being created and the data being analyzed.
Where is an analytics report needed?
Analytics reports are needed in settings where data is collected and analyzed. Some examples include:
- Strategy: Companies use analytics reports to track key performance indicators (KPIs), such as revenue, profit, and customer satisfaction, and to make data-driven decisions about strategy, operations, and marketing.
- Marketing: Marketing teams use analytics reports to track the effectiveness of their campaigns and to understand customer behavior, such as website engagement and purchase history.
- E-commerce: Online retailers use analytics reports to track website traffic, conversion rates, and sales data in order to optimize their online store and marketing efforts.
- Healthcare: Hospitals and other healthcare organizations use analytics reports to track patient outcomes, monitor the effectiveness of treatments, and measure the performance of their staff.
- Education: Educational institutions use analytics reports to track student performance, measure the effectiveness of instructional programs, and evaluate the performance of teachers and staff.
- Government: Government agencies use analytics reports to track economic, social, and environmental indicators, such as population growth, crime rates, and pollution levels.
These are just a few examples, but analytics reports are used in many other fields as well, such as finance, logistics, transportation, and many more.
What are the key takeaways from an analytical report?
The key takeaways from an analytical report are the main findings, insights, and conclusions that are drawn from the data analysis. These should be presented in a clear and concise manner and should provide actionable information that can be used to make decisions. Some examples of key takeaways from an analytical report might include:
- Summary of key metrics
- trends and patterns
- insights
- limitations
- recommendations
It's important that key takeaways are easy to understand and highlighted prominently in the report. This ensures that stakeholders can understand the most important findings and how it can be used to inform decision making.




 Customer Reviews




![25+ One-Page Performance Reports for a Result Driven Assessment [Free PDF Attached]](https://www.slideteam.net/wp/wp-content/uploads/2022/03/1013x441no-button-18-1013x441.jpg)
![[Updated 2023] 20 Pie Chart Templates to Draw Intuitive Comparisons](https://www.slideteam.net/wp/wp-content/uploads/2021/11/gif-1013x441-1-1013x441.gif)

![Top 10 HR Report Sample Templates to Enhance Your Recruitment Skills and Expertise [Free PDF Attached]](https://www.slideteam.net/wp/wp-content/uploads/2022/04/1013x441no-button-21-1013x441.jpg)

