


Website Analytics Report Powerpoint Ppt Template Bundles


Try Before you Buy Download Free Sample Product
 Impress Your
 Audience
Editable
of Time


Our Website Analytics Report Powerpoint Ppt Template Bundles are topically designed to provide an attractive backdrop to any subject. Use them to look like a presentation pro.
People who downloaded this PowerPoint presentation also viewed the following :
Website Analytics Report Powerpoint Ppt Template Bundles with all 17 slides:
Use our Website Analytics Report Powerpoint Ppt Template Bundles to effectively help you save your valuable time. They are readymade to fit into any presentation structure.


FAQs for Website Analytics Report Powerpoint
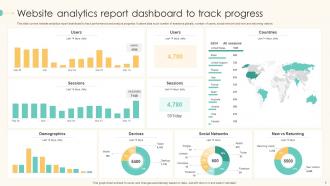
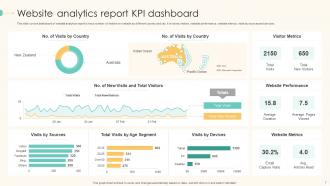
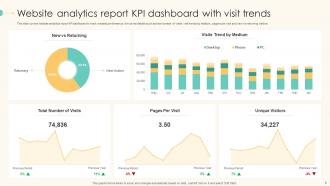
Honestly, start with the basics - how many people visit your site, bounce rate, time spent on pages. Then track conversions for whatever matters to your business (sales, email signups, whatever). Traffic sources are huge too because you need to know if Google, social, or direct visits are bringing people in. Mobile vs desktop stats help with user experience stuff. Page speed is actually way more important than most people realize - I learned that the hard way! Pick maybe 5-7 metrics max that connect to your actual goals. Otherwise you'll just drown in numbers and never do anything with them.
Analytics are seriously your best friend here. You'll see exactly where people bail out and which templates actually get downloaded vs. just browsed. Heat maps are pretty sick too - shows you where everyone's clicking and scrolling around. I'd start by checking bounce rates on your main pages first. Then look at which template previews get the most action. From there you can move popular stuff up top and fix any wonky navigation. Oh, and see how long people hunt around before finding what they want - that'll tell you if your categories make sense or not.
Definitely start with Google Analytics 4 - it's free and covers all the basics you need. Hotjar's great for heatmaps so you can see exactly where people are clicking on your template previews. Microsoft Clarity is another free option that does session recordings (honestly kind of fascinating to watch people navigate your site). You'll want to focus on tracking template downloads, how long people spend looking at previews, and where they're dropping off during checkout. I'd say go with GA4 plus one heatmap tool first, then add more once you figure out what you're missing.
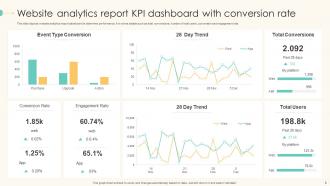
So you'll need to track a bunch of different points - landing page visits, actual downloads, plus if people come back for more templates. Set up those goal funnels in analytics to catch where users bail out. Here's the thing though: you gotta decide what "conversion" even means first. Is it just the download, or do they need to actually use the template? Track completion rates and how long people spend previewing stuff. Also monitor the good stuff like newsletter signups or premium upgrades after. Oh, and definitely create separate goals for each template type - some will totally flop while others crush it.
So bounce rate is basically how many people land on your site and immediately peace out without clicking anything. If you're consistently hitting 70%+ that's usually not great - means people aren't finding what they expected or your content just isn't hooking them. Though honestly, sometimes a high bounce rate isn't terrible if visitors got their answer right away and didn't need to dig deeper. I'd focus on your worst-performing pages first. Check which ones are bleeding visitors and start tweaking those. Quick wins make a difference.
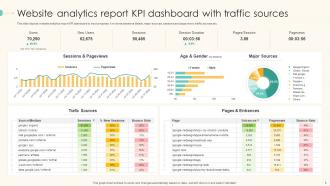
Dude, tracking where people find your templates is like having a cheat sheet for your marketing budget. Pinterest sending tons of visitors? Make more eye-catching pins. Getting sales from LinkedIn? Push your professional designs there harder. I swear, so many people blow their ad money on platforms where their customers aren't even hanging out. Each traffic source tells you something different about what people want and when they want it. Just peek at your top 3 sources every month and throw more money at whatever's actually bringing in business. Way better than guessing, honestly.
Honestly, demographic data shows some pretty cool patterns. Age groups tell you who's actually engaging with your stuff. Location data? That's where you see your real traffic sources. The gender and income breakdowns are solid for checking if you're hitting your target market - especially when you're figuring out product-market fit. Though fair warning, it's all estimates from browsing behavior so don't treat it like gospel. Here's what's actually valuable: compare this to your real customer data. You'll spot gaps between who visits versus who actually buys, which is kind of eye-opening.
Set up separate sections in your report tracking conversion rates, bounce rates, and engagement for each template variant. Goal tracking in your analytics will show you which design elements actually work - buttons, layouts, colors, whatever you're testing. Run tests long enough for statistically significant data (I know, waiting sucks but you need it). Document the winners and their impact percentages. Don't just track final purchases either - those micro-conversions matter too. Oh, and test one major element at a time so you don't muddy the results.
Session duration shows if people are actually sticking around to browse your templates. You want longer sessions - means they're checking out different designs, maybe even playing with customization tools. Anything under 2-3 minutes is pretty rough. I've seen some template sites averaging like 30 seconds, which is basically people bouncing immediately. That usually means your preview system sucks or navigation's confusing. If your numbers are low, fix the template previews first - make them easier to explore. Short sessions kill conversions.
So basically user flow analysis tracks exactly where people are bailing on your template sales - from when they first land on your site all the way through checkout. Super helpful for catching the annoying stuff that makes people leave, like when they can't find your pricing or get confused by your navigation. I swear, some checkout processes are like solving a puzzle nobody asked for. Check which pages have tons of people exiting or where users keep going backwards. Maybe they're getting stuck on payment options or your cart's being weird. Once you see the patterns, you can fix whatever's killing your sales.
Look, repeat visitor rates are basically gold for template sites. Low rates? Add stuff that makes people want to come back - resource libraries, comparison tools, maybe some kind of dashboard they can personalize. High bounce-back usually means your content hooked them initially but then... nothing. You should definitely segment those repeat visitors to see which templates keep drawing them back, then create more of that type. Oh, and here's the thing - email capture is huge for first-timers. Way better than crossing your fingers they'll remember your site later. Most people won't.
Dude, mobile users are like 60-70% of your viewers, so design for phones first. Big fonts, clean graphics, less clutter per slide - that's your friend. Desktop people stick around longer and actually download stuff, which is cool, but here's the thing: if your templates suck on mobile, most people bounce immediately. I learned this the hard way tbh. You want everything thumb-friendly for scrolling, but it still needs to look decent when someone pulls it up on their laptop to present. It's honestly harder than it sounds to nail both.
Track your traffic spikes during Black Friday, back-to-school, and New Year - that's when people actually buy templates. January's huge because of resolutions (obviously), then late summer hits when businesses prep for Q4. But here's the thing - high traffic doesn't always mean sales if you're just getting bargain hunters browsing around. Check which template categories work best each season. I'd set up those year-over-year comparisons in your analytics so you can spot patterns easily. Then time your marketing campaigns around what actually converts, not just when traffic peaks.
Honestly, social analytics shows you stuff your website data totally misses - like how people actually find your templates in the first place. Facebook and Instagram give you way better demographic info than regular web analytics, which is pretty huge. You can see which platforms bring the most engaged users and what content actually hits with your audience. The coolest part? Tracking someone from their first social interaction all the way to downloading a template. Oh, and social conversations definitely influence what people choose - that's gold right there. I'd connect Facebook Pixel with Google Analytics first to see where social engagement overlaps with actual sales.
Dude, the data is wild - tutorial content is absolutely destroying everything else on template sites. Your how-to guides get 3x more engagement than actual downloads, which honestly blew my mind at first. Makes sense though. People don't want to just grab templates and bail. They're hungry to learn customization tricks and advanced techniques. Posts like "How to Brand Your Template" keep users glued to your site way longer. Oh, and they come back more often too. I'd definitely load up your content calendar with educational stuff instead of just showing off pretty templates.
-
Their products can save your time, effort and money. What else you need. All in one package for presentation needs!
-
Excellent template with unique design.