


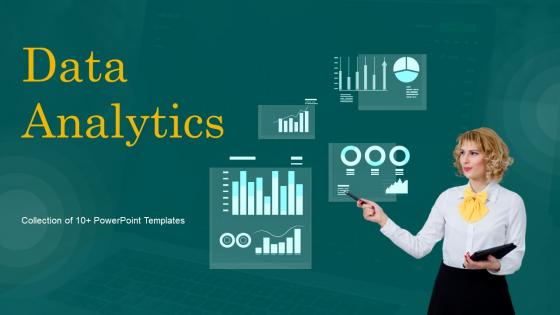
Data Analytics Powerpoint Ppt Template Bundles





Try Before you Buy Download Free Sample Product
 Impress Your
 Audience
 100%
100% Editable
 Save Hours
 of Time


Our Data Analytics Powerpoint Ppt Template Bundles are topically designed to provide an attractive backdrop to any subject. Use them to look like a presentation pro.
People who downloaded this PowerPoint presentation also viewed the following :
Data Analytics Powerpoint Ppt Template Bundles with all 18 slides:
Use our Data Analytics Powerpoint Ppt Template Bundles to effectively help you save your valuable time. They are readymade to fit into any presentation structure.






FAQs for Data Analytics Powerpoint
Look, you need four things sorted: solid business goals, decent data setup, good analytical tools, and people who actually get what the numbers mean. Most places nail the tech stuff but totally mess up defining what they're even trying to achieve - which is backwards if you ask me. Your data collection has to be clean from the start because garbage in, garbage out. The analytics folks need tech skills AND business sense to turn insights into real moves. Oh, and don't try to boil the ocean - pick one specific problem first, then work backwards from there.
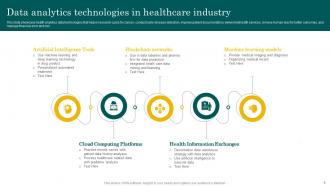
So it really depends on what each industry cares about most. Retail looks at buying patterns to stock shelves better and suggest stuff you'll actually want. Healthcare digs into patient data to see which treatments work. Finance is crazy obsessed with spotting fraud and measuring risk - they're like the data nerds of the business world. Manufacturing companies track equipment to predict when things might break down, which saves them tons of money. Even sports teams analyze player stats now for game strategy. The trick is figuring out which numbers actually move the needle for your business, then tracking those religiously.
Honestly, ML is a game-changer for analytics - it spots patterns you'd miss and predicts what's coming next instead of just showing what already happened. The speed difference is crazy too, like processing millions of rows in seconds vs waiting hours with regular methods. It's really good at catching weird outliers, grouping customers, and handling all that boring repetitive stuff automatically. Oh, and anomaly detection is probably my favorite feature. I'd start with something simple like churn prediction or sales forecasting - you'll see results pretty quickly and it's not overwhelming.
Yeah totally! Google Analytics is free and honestly most small businesses are already sitting on goldmines of data in their CRM or social accounts - they just don't realize it. Excel works fine for basic stuff, or try Tableau Public if you want something fancier. Even Canva does decent dashboards now which is kinda wild. The real issue isn't money though, it's actually remembering to check your numbers regularly. I'd say pick literally one metric you care about and track it weekly. Once that becomes automatic, add more. Don't overthink it at first.
Oh man, data silos are gonna be your biggest headache - every department hoards their info differently. Plus people absolutely hate changing how they work, which I totally get. Your legacy systems won't cooperate with newer tools either. And don't get me started on the "we've always done it this way" crowd. Here's what actually works though: pick one small area first instead of trying to fix everything. Prove it helps, then slowly expand. Way less drama that way, and people will actually get on board once they see results.
Honestly, once you start using charts and graphs, you'll wonder how you ever made sense of raw spreadsheets. Your brain just processes visuals way faster - we're talking seconds instead of staring at numbers forever. Bar charts and line graphs turn messy data into actual stories you can understand. Plus they make presenting to your team so much easier since nobody wants to scroll through endless rows of data (been there). The coolest part? You'll spot trends and weird outliers that you'd totally miss otherwise. Just try a simple chart with your next dataset and you'll get it immediately.
Dude, privacy is your biggest concern - get consent and protect people's info properly. Also be transparent about how you're using their data. Bias is sneaky too, like your algorithm might accidentally discriminate without you even knowing. Don't oversell what your data actually shows either, that's just misleading. Honestly the whole field moves so fast it's hard to keep up sometimes. But here's what works for me: just ask yourself if you'd be cool with someone handling YOUR data the same way. That gut check usually keeps you honest.
Validation checks at every entry point are your first line of defense. Set up automated flags for duplicates, missing values, weird inconsistencies - basically anything that looks off before it hits your pipeline. You'll want standardized formats across all sources too. Regular audits are non-negotiable, trust me. I've watched teams skip this step and their insights end up being garbage. Train people on proper data entry (sounds boring but it matters). Oh, and assign specific data stewards to own quality for different datasets. Without that ownership, it becomes this vague responsibility that nobody actually tackles.
Know your audience first - how technical can you actually get with them? Lead with the big insights, then get into the weedy stuff later. I've watched so many solid analyses die because they got buried in jargon and messy charts. Your visualizations should tell a story, not just dump data everywhere. Be upfront about limitations and confidence levels so people know what they're dealing with. Give them actual next steps, not just a pile of numbers. Oh, and test it on someone outside your team first - they'll spot all the stuff you think is obvious but really isn't.
So basically, it's all about timing. Real-time analytics handles data as it comes in - like, within seconds or minutes. You get instant insights and can react right away to what's happening. Traditional analytics? That's more your overnight batch processing, weekly reports, that kind of thing. Honestly, real-time is amazing for alerts and live dashboards when you need to know NOW. But traditional still rocks for spotting bigger trends over time. Just depends what you're trying to do - immediate response vs deeper pattern analysis.
Honestly, SQL and Python are must-haves - can't get around those anymore. Excel too, which sounds boring but you'll use it more than you think. Statistics obviously matters a lot. For visualization stuff, learn Tableau or Power BI. The thing people don't realize is how much you'll be presenting to executives who barely know what a spreadsheet is, so communication skills are actually super important. Oh and throw in some basic machine learning knowledge. I'd start with SQL first since it's easier to pick up, then move to Python. That combo will get you interviews pretty quickly.
Dude, predictive analytics is wild - you can literally spot which customers are about to bail before they do. I've seen companies catch people right before they cancel and turn them around. You'll know what someone wants to buy next, when they'll need help, all that stuff. Way better than just scrambling to fix things after they happen. The personalization gets crazy good too, and your customer lifetime value shoots up. Oh, and don't go overboard at first - just try churn prediction or something simple. Prove it works, then expand from there.
Honestly, big data changed everything about analytics. We went from working with small datasets to analyzing massive stuff - social media feeds, sensor data, you name it. Real-time insights into customer behavior that we couldn't even dream of before. But here's the catch: you need way better tools now. Excel? Forget about it. Python, SQL, cloud platforms - that's where you gotta be comfortable. Machine learning too, which still feels weird to say out loud sometimes. Traditional methods just can't handle the scale anymore, so if you're serious about this field, start learning those newer tools now.
So sentiment analysis basically tracks what people *really* think about your brand - like on social media, reviews, all that stuff. You can catch problems before they explode (which honestly saves your ass). Plus you'll see which campaigns people actually love vs hate. Here's the cool part - you can group customers by how they feel and hit them with messages that work for their vibe. Oh, and watching competitors mess up? Chef's kiss. Just make sure you set up automatic tracking so you're not finding out about disasters three weeks too late when everyone's already moved on.
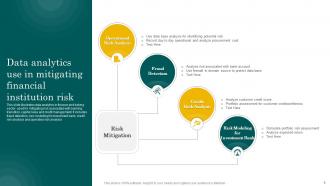
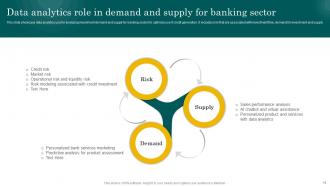
Data analytics can help you catch market volatility patterns and predict credit defaults before they wreck your finances. Real-time dashboards are clutch for spotting weird trading activity. Monte Carlo simulations make stress testing way more powerful - though honestly, setting them up is kind of a pain at first. The algorithms get scary good at crunching historical data to model different risk scenarios. Oh, and fraud detection becomes much sharper too. I'd start with whatever's causing you the biggest headaches right now and build your analytics around that specific problem first.
-
Really like the color and design of the presentation.
-
SlideTeam is my one-stop destination for templates. Highly recommended!